AVEDEV function - The function returns the average absolute deviation of data points from their midpoint in Excel
AVEDEV function: The function returns the average absolute deviation between a given data point and the average value of the population. The function is a measure of the variability of a dataset
The following article details in detail how to use AVEDEV function, the function of calculating the average of absolute deviation in Excel.

Description: The function returns the average absolute deviation between a given data point and the average value of the population. The function is a measure of the variability of a dataset.
Syntax: AVEDEV (number1, [number2], .) .
Inside:
- number1, number2, . : are the arguments to calculate the standard deviation, where number1 is the required parameter, the optional next parameters and the number of parameters is from 1 to 255 parameters.
Attention:
- AVEDEV function depends on the input data unit.
- The arguments must be a number, name or reference array that contains numeric values.
- If the parameter is a logical value or presents a number as a text you want to not be error, you should type directly into the list of arguments.
- Arguments that contain logical values, text, and blank cells are ignored, but cells with a value of 0 are still counted.
- Equation of AVEDEV function :

For example:
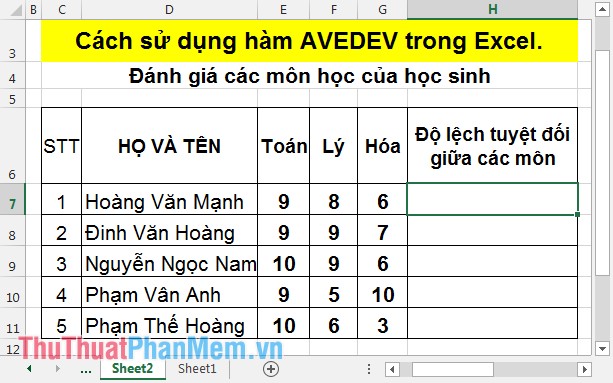
Evaluate students' level of subjects evenly by subject grades.
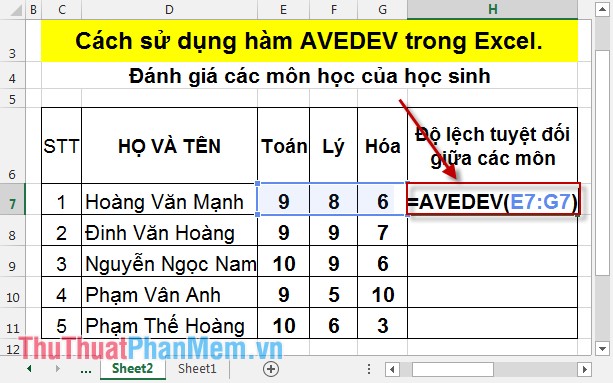
In the cell to calculate the absolute deviation between the subjects that enter the formula: = AVEDEV (E7: G7) .
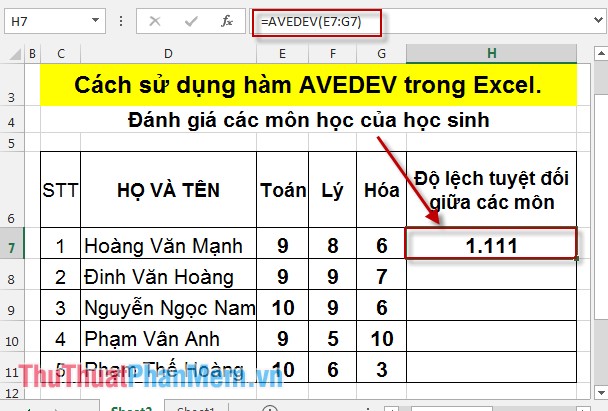
Press Enter -> the absolute deviation result between 3 subjects of the student is:
Similarly copying the formula for the remaining data cells results:

Here the absolute difference between subjects is smaller, indicating that students learn very 3 subjects of math, physics, chemistry such as Hoang, Manh. The greater the absolute deviation, the more likely it is that she has not yet studied subjects like Hoang and Van Anh.
The above is a common usage and case of AVEDEV function .
Good luck!
Was this article helpful?
Your feedback helps us improve.
Related Articles
 AVEDEV function3 minutes read
 COVARIANCE.P function - The function returns the covariance of a set, the product of the average of degrees of instruction for each pair of data points in Excel3 minutes read
 NORM.S.INV function - The function returns the inverse of the normalized distribution with an average value of 0 and a standard deviation of 1 in Excel2 minutes read
 STDEV.P function - The function returns the standard deviation based on the whole in Excel3 minutes read
 GEOMEAN function - The function returns the average of a positive array or range of data in Excel2 minutes read
 TRIMMEAN function - The function returns the average of the inner part of a dataset in Excel2 minutes read
Reader Comments 0
Sign in with email or Google to join the discussion.