COVARIANCE.S function - Returns the covariance pattern, the average of product deviations for each pair of data points in two data sets in Excel
COVARIANCE.S function: Returns the covariance, the product of the deviations for each pair of data points in two data sets Syntax: COVARIANCE.S (array1, array2)
The following article introduces you to the COVARIANCE.S function - one of the functions in the statistical function group is very popular in Excel.

Description: Returns the sample covariance, the product of the deviations for each pair of data points in the two data sets
Syntax: COVARIANCE.S (array1, array2)
Inside:
- array1: The first range contains integers that want to calculate the variance, is a required parameter.
- array2: The second range contains the integers that want to calculate the variance, is a required parameter.
Attention:
- The argument must be either a number or a reference array that contains numbers.
- If the reference argument or array contains text or logical values or empty cells will be ignored.
- If array1 and array2 have different data points -> the function returns the # N / A error value
- If 1 of the 2 arrays is empty -> the function returns the # DIV / 0 error value
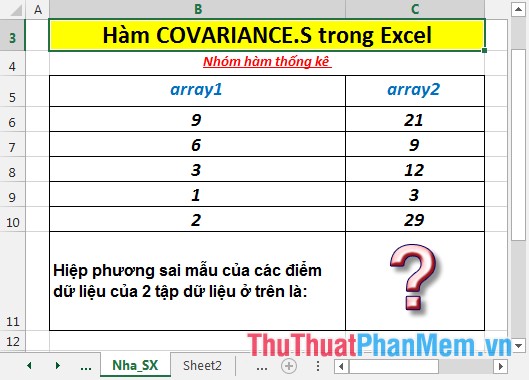
For example:
Calculate the sample covariance, the average of the product of deviations of each data point pair of the two data sets in the following table:
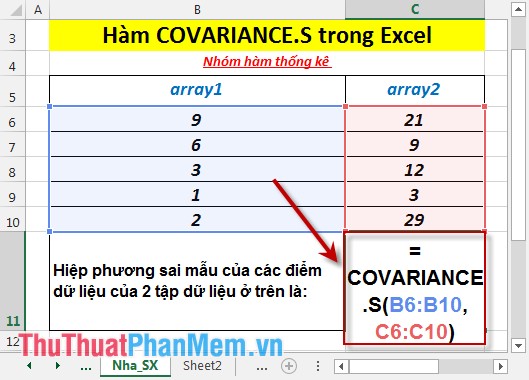
- In the cell to calculate enter the formula : = COVARIANCE.S (B6: B10, C6: C10)
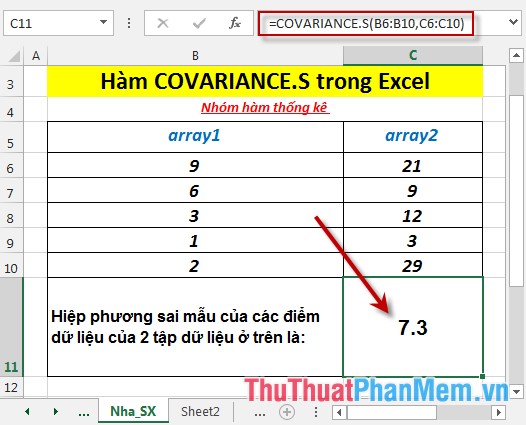
- Press Enter -> covariance sample, the average of the product of deviations of each data point pair of two data sets is:
- Where the number of pairs of points of 2 arrays is not the same -> the function returns the # N / A error value
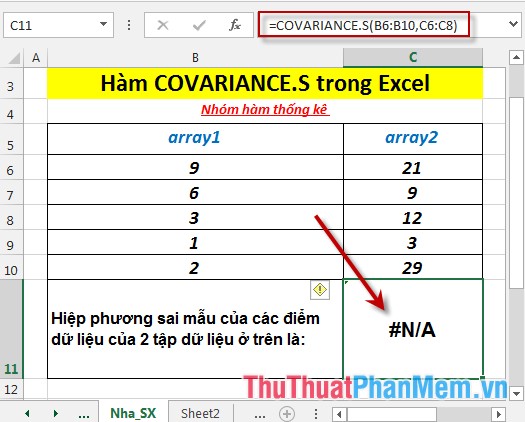
Here array2 only contains 3 values from C6: C8
Above are instructions and some specific examples when using the COVARIANCE.S function in Excel.
Good luck!
Was this article helpful?
Your feedback helps us improve.
Related Articles
 COVARIANCE.P function - The function returns the covariance of a set, the product of the average of degrees of instruction for each pair of data points in Excel3 minutes read
 DEVSQ function - The function returns the sum of squares of deviations of data points from the sample mean in Excel2 minutes read
 DEVSQ function in Excel The function returns the sum of squares of deviations between data points from their average3 minutes read
 PEARSON function - The function returns the Pearson product moment correlation coefficient in Excel3 minutes read
 F.DIST.RT function - The function returns the right probability distribution F for 2 data sets in Excel2 minutes read
 CORREL function - The function returns the correlation coefficient between two data sets in Excel2 minutes read
Reader Comments 0
Sign in with email or Google to join the discussion.