TRIMMEAN function - The function returns the average of the inner part of a dataset in Excel
The following article introduces you to the TRIMMEAN function - one of the functions in the statistical group is very popular in Excel.
Description: The function returns the average of the interior of the data set. The function calculates by removing which percentage of the value is in the first or last boundary of the data set.
Syntax: TRIMMEAN (array, percent)
Inside:
- array: The array or range of data to trim and average, which is the required parameter.
- percent: The percentage of data points to be removed from the calculation, which is a required parameter.
Attention:
- If Percent <0 or Percent> 1 -> the function returns the #NUM! Error value
- TRIMMEAN function rounds the number of excluded data points to the nearest multiple of 2.
For example:
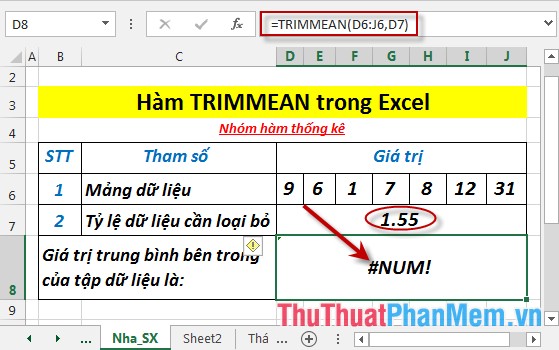
Calculate the internal mean of the data set described in the following data table:
- In the cell to calculate enter the formula : = TRIMMEAN (D6: J6, D7)
- Press Enter -> The average value inside of the data set is:
- In case the data rate to be removed is greater than 1 or less than 0 -> the function returns the #NUM! Error value
Above are instructions and some specific examples when using TRIMMEAN function in Excel.
Good luck!
You should read it
- AVEDEV function - The function returns the average absolute deviation of data points from their midpoint in Excel
- QUARTILE.EXC function - The function returns the quartile of a dataset without values 0 and 1 in Excel
- LARGE function - The function returns the kth largest value in a dataset in Excel
- QUARTILE.INC function - The function returns the quartile of a dataset including values 0 and 1 in Excel
- KURT function - The function returns the sharp coefficient of a dataset in Excel
- PERCENTRANK.INC function - The function returns the rank of a value in a dataset as a percentage including values 0 and 1 in Excel
- PERCENTRANK.EXC function - The function returns the rank of a value in a dataset as a percentage excluding values 0 and 1 in Excel
- GEOMEAN function - The function returns the average of a positive array or range of data in Excel
May be interested
- VAR.P function - Function that calculates variance based on the entire set, ignoring logical values and text in Excelvar.p function: function that calculates variance based on the entire set, ignoring logical values and text. support functions from excel 2010 onwards. syntax: var.p (number1, [number2], ...)
- VAR.S function - Function that calculates variance based on a sample, ignoring logical values and text in Excelvar.s function: function that calculates variance based on a sample, ignoring logical values and text. support functions from excel 2010 onwards. syntax: var.s (number1, [number2], ...)
- VARA - Function that calculates variance based on a sample, including logical values and text in Excelvara function: the function performs a calculation of variance based on a sample, including logical values and text. syntax: vara (value1, [value2], ...)
- VARPA function - Function that calculates variance based on the entire set, including logical values and text in Excelvarpa function: function that calculates variance based on the entire set, including logical values and text. syntax: varpa (value1, [value2], ...)
- Z.TEST function - The function returns one-sided value of the z test in Excelz.test: the function returns the one-sided p value of the z test. support functions from excel 2010 onwards. syntax: z.test (array, x, [sigma])
- LINEST function - The function returns a line description array using the least square method in Excellinest function: the function returns the line description array using the least squares method. syntax: linest (known_ys, [known_xs], [const], [stats])