GEOMEAN function - The function returns the average of a positive array or range of data in Excel
GEOMEAN function: The function returns the average of a positive array or range of data. Use the function to calculate the average growth when knowing the gross profit with variable interest rates. Syntax: GEOMEAN (number1, [number2], ...)
The following article introduces you to GEOMEAN functions - one of the functions in the statistical function group is very popular in Excel.

Description: The function returns the kernel average of a positive data range or range. Use the function to calculate the average growth when knowing the gross profit with variable interest rates.
Syntax: GEOMEAN (number1, [number2], .)
Inside:
- number1, number2, .: The value you want to calculate the standardized overall probability, where number1 is the required parameter, other parameters are optional and contain up to 255 number parameters .
Attention:
- Parameter values can be numbers, names or arrays of references.
- If the logical values, the text is entered directly into the function -> these values are still counted
- If the argument is a reference or an array containing logical values, text or blank cells -> the function ignores these values.
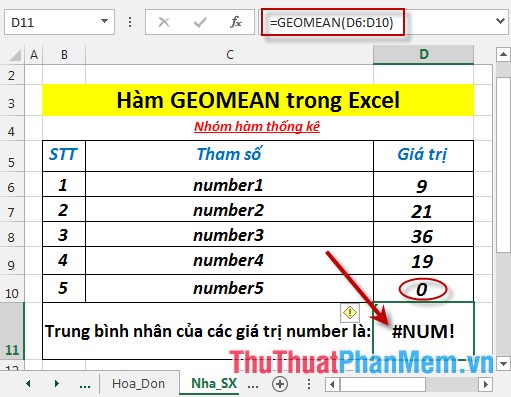
- If any value of number ≤ 0 -> the function returns the #NUM! Error value
- Arguments that are text or error values cannot be converted into numbers -> error function
- GEOMEAN function calculated based on the equation:
[G {M_ {bar y}} = sqrt [n] {{{y_1} {y_2} {y_3} . {y_n}}}]
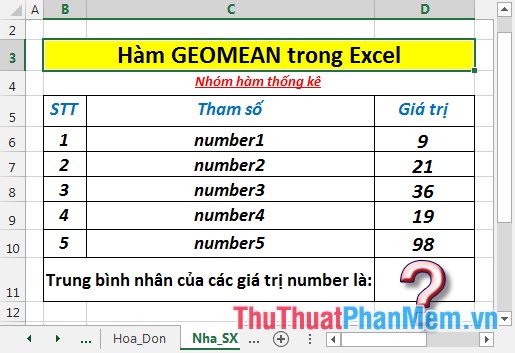
For example:
Calculate the average of the values in the data table below:
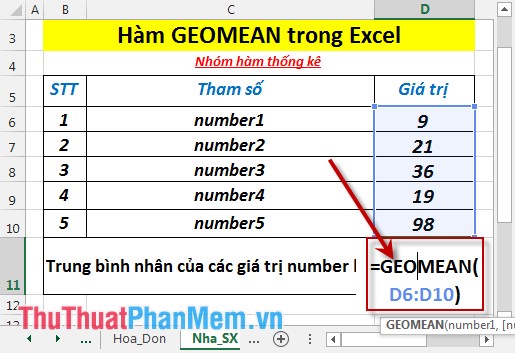
- In the cell to calculate enter the formula : = GEOMEAN (D6: D10)
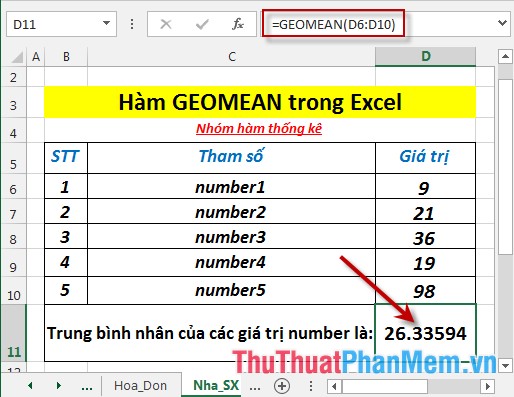
- Press Enter -> The average of the values is:
- Where the value of number ≤ 0 -> the function returns the #NUM! Error value
- Where number is a logical value or text -> the function ignores those values.

Above are instructions and some specific examples when using GEOMEAN function in Excel.
Good luck!
Was this article helpful?
Your feedback helps us improve.
Related Articles
 TRIMMEAN function - The function returns the average of the inner part of a dataset in Excel2 minutes read
 The MODE function (returns the value with the most frequent occurrence in an array or data range) in Excel3 minutes read
 How to use the Match function in Excel5 minutes read
 MODE.SNGL function - Function that returns the most frequently occurring, or the most repeated values in an array or data range in Excel3 minutes read
 MODE.MULT function - The function returns a vertical array of the most common values in Excel3 minutes read
 The Match function (the function searches for a specified value in an array or cell range) in Excel4 minutes read
Reader Comments 0
Sign in with email or Google to join the discussion.