COVARIANCE.P function - The function returns the covariance of a set, the product of the average of degrees of instruction for each pair of data points in Excel
COVARIANCE.P function: Returns the covariance of the population, the average of the product deviations for each pair of data points in the two data sets Syntax: COVARIANCE.P (array1, array2)
The following article introduces you to the COVARIANCE.P function - one of the functions in the statistical function group is very popular in Excel.

Description: Returns the covariance of the population, the average of the deviations for each pair of data points in the two data sets.
Syntax: COVARIANCE.P (array1, array2)
Inside:
- array1: The first range contains integers that want to calculate the variance, is a required parameter.
- array2: The second range contains the integers that want to calculate the variance, is a required parameter.
Attention:
- The argument must be either a number or a reference array that contains numbers.
- If the reference argument or array contains text or logical values or empty cells will be ignored.
- If array1 and array2 have different data points -> the function returns the # N / A error value
- If 1 of the 2 arrays is empty -> the function returns the # DIV / 0 error value
- Functions that perform calculations based on formulas:
[Covleft ({X, Y} right) = frac {{sum {left ({x - overline x} right) left ({y - overline y} right)}}} {n}]
Inside:
({overline x}) and ({overline y}) are sample mean AVERAGE (array1) and AVERAGE (array2 ) and n are sample sizes.
For example:
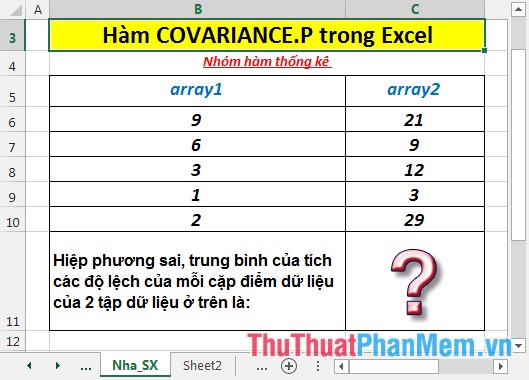
Calculate the covariance, the average of the product of deviations of each data point pair of the two data sets in the following table:
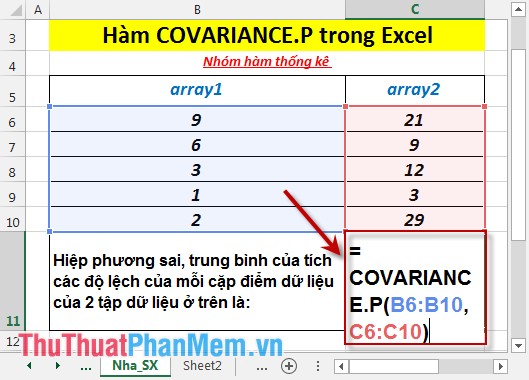
- In the cell to calculate enter the formula : = COVARIANCE.P (B6: B10, C6: C10)
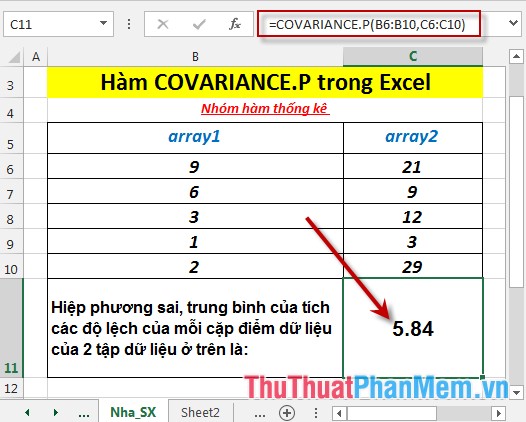
- Press Enter -> covariance, the average of the product of deviations of each data point pair of two data sets is:
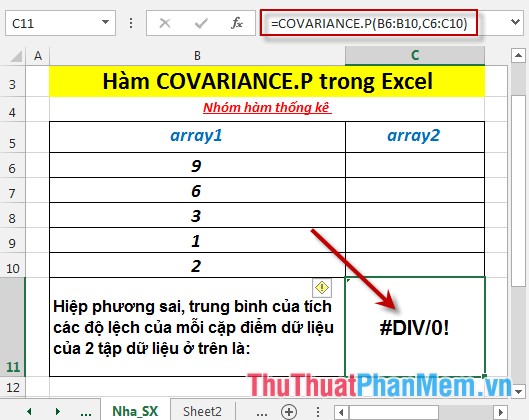
- Where 1 of 2 arrays is blank -> the function returns the # DIV / 0 error value
- Where the number of data points of the two arrays is not the same -> the function returns the # N / A error value .

Above are instructions and some specific examples when using the COVARIANCE.P function in Excel.
Good luck!
Was this article helpful?
Your feedback helps us improve.
Related Articles
 COVARIANCE.S function - Returns the covariance pattern, the average of product deviations for each pair of data points in two data sets in Excel2 minutes read
 SLOPE function - The function returns the slope of a linear regression line through data points in Excel3 minutes read
 AVEDEV function - The function returns the average absolute deviation of data points from their midpoint in Excel2 minutes read
 CHISQ.TEST function - The function returns the independence test in Excel3 minutes read
 DEVSQ function - The function returns the sum of squares of deviations of data points from the sample mean in Excel2 minutes read
 How to use the NORMDIST function in Excel - Function that returns the distribution in Excel3 minutes read
Reader Comments 0
Sign in with email or Google to join the discussion.