FTEST function - The function returns the result of an F-Test in Excel
The following article details how to use FTEST - The function returns the result of an F-test. In statistical probability, the determination of the correctness and the deviation between two data samples is a regular and extremely important job.
In statistical probability, the determination of the correctness and the deviation between two data samples is a regular and extremely important job. The following article shows in detail how to use FTEST - The function returns the results of the F-test to help you solve the above problem.
Description: The function that returns the result of an F-test or is the probability of two ends where the difference or the variance in the data arrays is not significant. Functional application of testing two data samples to see how their variances differ.
Syntax: FTEST (array1, array2) .
Inside:
- array 1 : The first array of data range to check, is a required parameter.
- array 2 : The second array of data range to check, is a required parameter.
Attention:
- The parameters must be either numbers or names, arrays or references must contain numeric values.
- If one of the two parameters contains a logical value or a blank text, the function will ignore that value.
- The number of points in the 2 parameters must be greater than or equal to 2 and the variance of the 2 parameters must be different from zero, otherwise the function returns the # DIV / 0 error value.
- Pay attention to distinguish two F-test values of LINEST function and FTEST function, F- test of LINEST function used in F statistics, and F-test function FTEST returns a probability value.
For example:
Give the following data sheet. Calculate the value of F-test.

In the cell to be calculated enter the following formula: = FTEST (D6: I6, D7: I7).

Note the value of the result cell you should put in decimal format with at least 2 decimal places. Because the value is usually less than 1 if you format the integer, the result returns 0. The result is calculated as:
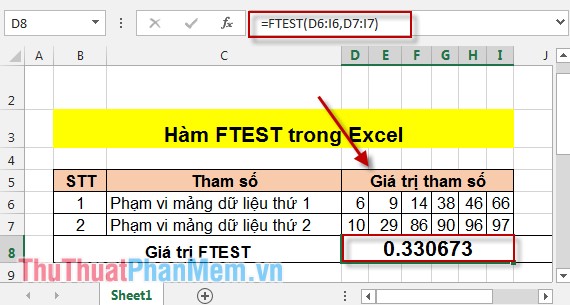
So the probability of the difference between the two data arrays is 0.330673.
Above is how to use FTEST function, wish you success!
Was this article helpful?
Your feedback helps us improve.
Related Articles
 F.TEST function - The function returns the result of the F - test in Excel2 minutes read
 BINOM.DIST.RANGE function - The function returns the probability of a test result using binomial distribution in Excel3 minutes read
 CHISQ.TEST function - The function returns the independence test in Excel3 minutes read
 Z.TEST function - The function returns one-sided value of the z test in Excel3 minutes read
 T.TEST function - The function returns the probability associated with Student's t-Test in Excel3 minutes read
 ZTEST function - Returns the probability value on one side of the z test in Excel3 minutes read
Reader Comments 0
Sign in with email or Google to join the discussion.