SKEW function - The function returns the deviation of the distribution in Excel
SKEW function: The function returns the deviation of the distribution - the deviation represents the asymmetry of the distribution around its axis. - Negative deviations: The distribution with the asymmetric side extends more to the negative value. - Positive deviation: The distribution with the asymmetric side extends much to g
The following article introduces you to SKEW function - one of the functions in the statistical function group is very popular in Excel.

Description: The function returns the deviation of the distribution - the deviation represents the asymmetry of the distribution around its axis.
- Negative deviations: The distribution with the asymmetric side extends more to the negative value.
- Positive deviations: The distribution with the asymmetric side extends more to the positive value.
Syntax: SKEW (number1, [number2], .)
Inside:
- number1, [number2], .) : The values you want to calculate the deviation, where number1 is the required value, the next values are optional and contain up to 255 number parameters .
Attention:
- The value of the argument must be a number, name, array or reference containing numbers.
- Logical values and text number representations when typing directly into the argument list -> still count.
- Arguments that are text or error values cannot be converted to a numeric type -> cause the function to cause an error .
- If the argument is a reference array containing text values or logic -> these values are ignored, but the value 0 is still counted.
- If there are fewer than 3 data points or the standard deviation is 0 -> the function returns the # DIV / 0 error value .
- The deviation equation is determined by the formula:
[frac {n} {{left ({n - 1} right) left ({n - 2} right)}} {sum {left ({frac {{{x_i} - bar x}} {s}} right) } ^ 3}]
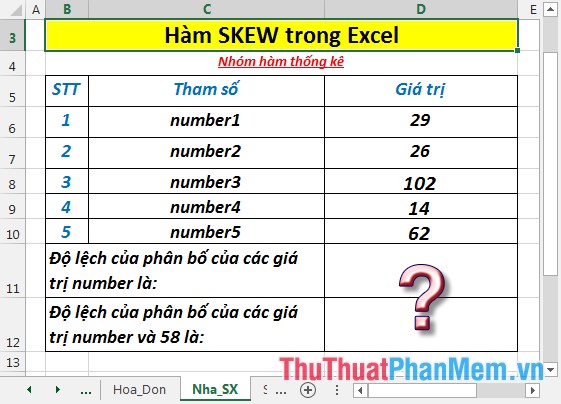
For example:
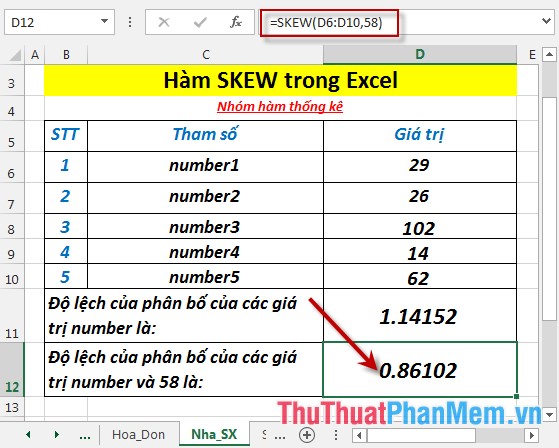
Calculate the deviation of the distribution of values in the following data table:
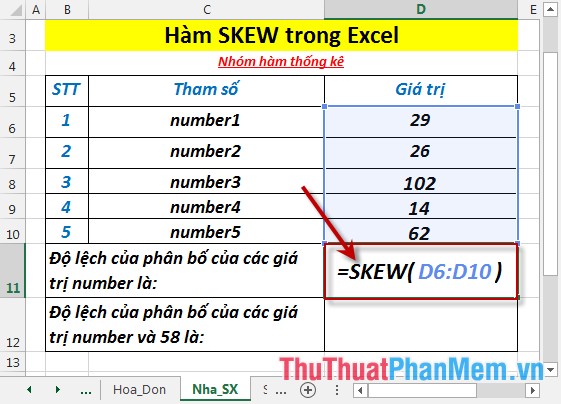
- Calculate the deviation of the distribution of number values . In a cell to calculate enter the formula : = SKEW (D6: D10)
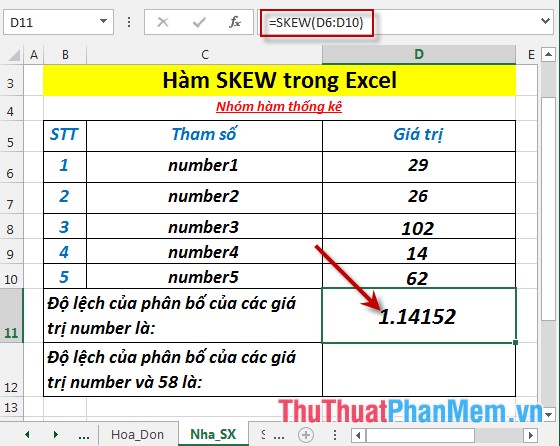
- Press Enter -> deviation of distribution of number values is:
- Calculate the deviation of the distribution of the values of number and 58. In the cell to calculate enter the formula : = SKEW (D6: D10,58)
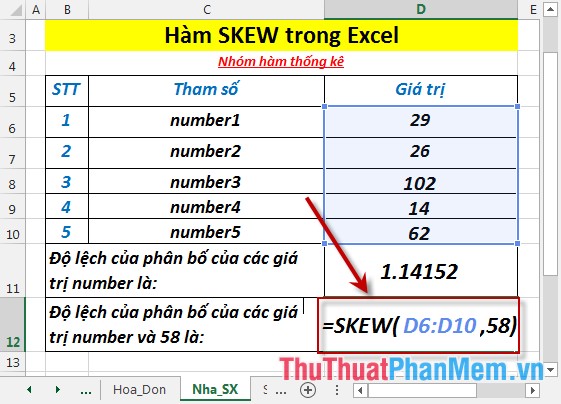
- Press Enter -> deviation of the distribution of the numbers number and 58 are:
Above are instructions and some specific examples when using SKEW function in Excel.
Good luck!
Was this article helpful?
Your feedback helps us improve.
Related Articles
 NORM.S.DIST function - The function returns the normalized distribution with a mean of 0 and a standard deviation of 1 in Excel2 minutes read
 NORM.DIST function - The function returns the normal distribution with the standard deviation and the mean value specified in Excel3 minutes read
 How to use the NORMDIST function in Excel - Function that returns the distribution in Excel3 minutes read
 NORM.S.INV function - The function returns the inverse of the normalized distribution with an average value of 0 and a standard deviation of 1 in Excel2 minutes read
 LOGNORM.INV function - The function returns the inverse of the logarithmic distribution of x in Excel2 minutes read
 LOGNORM.DIST - Function returns the logarithmic distribution of x in Excel2 minutes read
Reader Comments 0
Sign in with email or Google to join the discussion.