The STOCKHISTORY function in Excel
In Excel, the STOCKHISTORY function is a new function, currently available in Beta for users who register for Microsoft 365. Refer to the following article to use the STOCKHISTORY function effectively.
Table of Contents
Microsoft has just added the STOCKHISTORY function to Excel. This new Excel function is designed based on the flexibility of dynamic arrays and the ability to gather information from cloud-connected Stocks data types by providing access to historical data.

The concept and usage of the STOCKHISTORY function in Excel.
The STOCKHISTORY function in Excel
The syntax for the STOCKHISTORY function in Excel is as follows:
In there:
Stock : is the targeted exchange identifier, it can be a ticker symbol or Stocks data type.
start_date : is the start date you want to receive information.
end_date (optional) : the last date you want to receive information.
interval (this parameter is optional) : includes day (0), week (1) and month (2) options.
headers (optional parameter) : specifies if additional header rows are returned by array.
property0 - property5 (optional parameter) : specifies which information will be included in the results, date (0), close (1), open (2), high (3), low (4), trading volume (5).
For example, the STOCKHISTORY function in Excel.
Example 1
Given the following Excel function:
=STOCKHISTORY("MSFT", "January 6, 2020", "May 6, 2020")
In the example above, we use the stock ticker symbol MSFT. The start_date and end_date inputs are converted by Excel to the appropriate date format, similar to how the DATEVALUE function works.
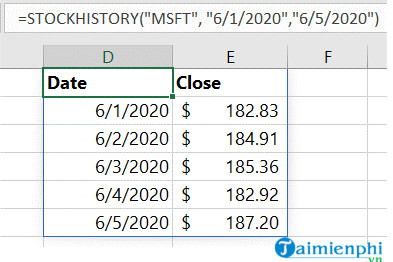
Note: Ensure that text values are enclosed in quotation marks in Excel function input.
Example 2: Choose a specific exchange
If a stock ticker symbol is used as input without a specific exchange being designated, the default assigned stock exchange value is XNAS (NASDAQ).
There are two ways to specify the exchange you want to target in Excel:
- Method 1: Using market identification numbers
The first method is to use the Market Identifier Code + colon ":" + stock code to retrieve data from a specific exchange.
=STOCKHISTORY("XMIL:MSFT", TODAY()-7, TODAY())
In this example, TipsMake specifies the stock ticker symbol MSFT on the Borsa Italiana exchange ("XMIL:MSFT") and requests data for the last 7 trading days using the TODAY() function. This function updates when the date changes.
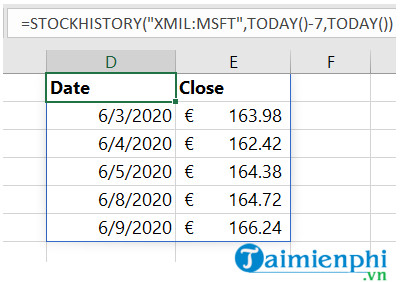
Note: Stock prices are quoted in Euros.
- Method 2: Using the Stocks data type
The second method is to use the cell containing the Stock data type as a reference within the function, just like referencing any other cell.
=STOCKHISTORY(B1, B3, B4)
In the example above, the Stock data type is used, and the data is retrieved from the Mexican stock exchange. The cell containing the STOCKHISTORY function data type (B1) passes a reference to the cells containing the dates (B3 and B4).
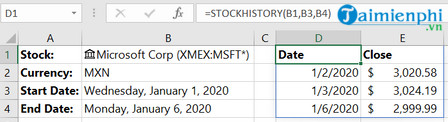
If you edit the value of any cell (including cells B1, B3, or B4), the STOCKHISTORY function will recalculate based on the new values of those cells.
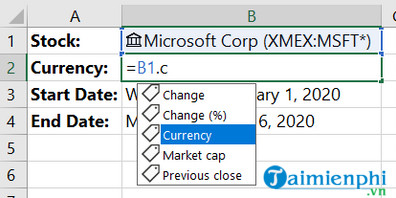
Additionally, using Stock data allows you to see which currency is being used. Enter the formula "=B1.Currency ", where B1 refers to the cell containing the Stock data type.
Example 3
The example below illustrates all the properties of the STOCKHISTORY function:
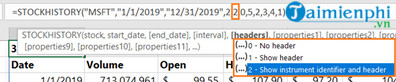
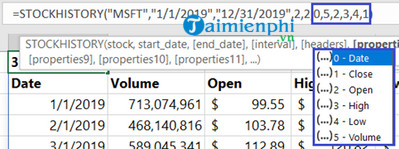
STOCKHISTORY("MSFT","1/1/2019","12/31/2019",2,2,0,5,2,3,4,1)
The above function uses all inputs to create a 2D data array. This data relates to Microsoft stock from January to December 2019, including trading volume, open interest, highs, lows, and the number of shares traded during those months.
In the function above:
- "MSFT" is the stock ticker symbol for Microsoft.
- "1/1/2019" is the start date.
- "12/31/2019" is the end date.
- Value 2: displays a monthly overview.
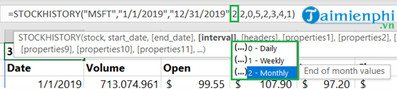
- Value 2: includes both the stock code and the product name in the returned results array.
- Values 0, 5, 2, 3, 4, 1: These are the attributes you want to display in the results array. In this case, they are the date, trading volume, open, high, low, and closed stock. - "MSFT" is the ticker symbol for Microsoft.
- "1/1/2019" is the start date.
- "12/31/2019" is the end date.
- Value 2: Displays the monthly overview.
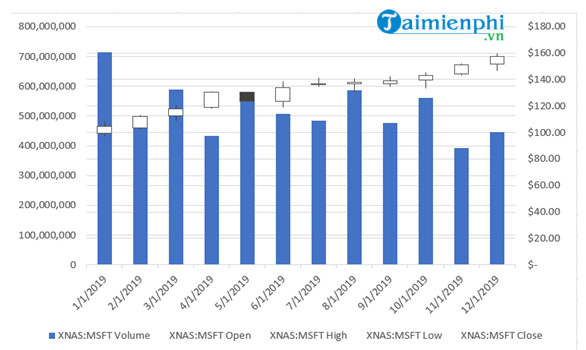
To select this data, go to the Insert tab , then find and click Recommended Charts => All Charts => Stock and insert the chart showing trading volume - open - high - close - closed stock.
The article above, TipsMake has just introduced you to the STOCKHISTORY function in Excel. In addition, readers can refer to some other articles already available on TipsMake to learn more about the VLOOKUP function , examples, and how to use it.
Was this article helpful?
Your feedback helps us improve.
Related Articles
 The Index function in Excel: Formulas and usage.7 minutes read
 How to use the VALUE function in Excel - A function to convert a string to a number.1 minutes read
 Basic Excel functions that anyone must know10 minutes read
 How to use Hlookup function on Excel3 minutes read
 How to use the SUM function to calculate totals in Excel7 minutes read
 DATE Function: Converts numbers to a valid date format4 minutes read
Reader Comments 0
Sign in with email or Google to join the discussion.