How to draw flow charts in PowerPoint
The flowchart, called PowerPoint, will create a step-by-step process diagram.
Table of Contents
In addition to drawing basic diagrams in PowerPoint from shapes, users also have a flowchart or trigger called flow diagram, block diagram or flow chart. Flowchart is a diagram that shows the steps in a process, showing the work steps in the form of different geometries in sequence, connected by arrows. Viewers rely on the flowchart to know how the process is done and how to proceed. To draw a flowchart in PowerPoint at a basic level is simple and not too complicated. The following article will guide you how to draw flow charts in PowerPoint.
- How to draw flow charts in Excel
- Instructions on how to draw diagrams in Word
- Mind mapping in PowerPoint
- How to design PowerPoint with Text box and SmartArt
Guide to drawing flowchart in PowerPoint
Step 1:
First of all, we need to create a flowchart grid to get the dimensions between the frames uniformly. Click on View and then select Gridlines below.

The result is a grid like the one below to create a frame.

Step 2:
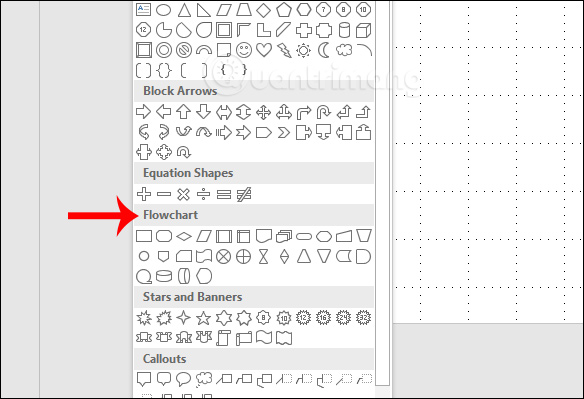
Click on Insert then select Shapes to select the flowchart. Flowchart shapes are usually simple geometry and arrows to connect shapes to each other, showing the sequence of steps.

Each shape is used for purposes and shows different content. Find the Flowchat item in the list that will display the shapes that are often used to draw a flowchart.
- Rectangle: rectangles are often used for process steps.
- Shuttle pattern: the shuttle shape is used to represent decision points in a process.
- Oval shape: this image is usually chosen as the beginning and end points, indicating the start and end points of a process.
Also when you hover your mouse over each of the shapes in the Flowchart section, it is also clear that the purpose is used for the user to make the right choice.
Step 3:
Select the first cube for the flowchart and draw it into the grid in the PowerrPoint interface. Because of the grid shape, it is easy to adjust the size, length and width for the frames.

Step 4:
After drawing the first image, the Format tab displays so that we can adjust the shape, border, color, . for the shape.

Next click on the cube and enter the content and then adjust the format of the text in the cube.

Step 5:
Continue drawing other shapes to show the process you need to show on PowerPoint.

To connect between the two shapes we will select the arrows in the Line section. Click on the center point at the bottom edge of the first cube and straight down to the center point of the bottom cube.

Step 6:
When you drop instead of arrow, you also have the option to edit the arrow with the width, arrow color, etc.

The result is the first part of the flowchart as shown below.

If you want to use this arrow as the default arrow for the current flowchart, with the arrow format in use, right-click the arrow and select Set as Default Line .
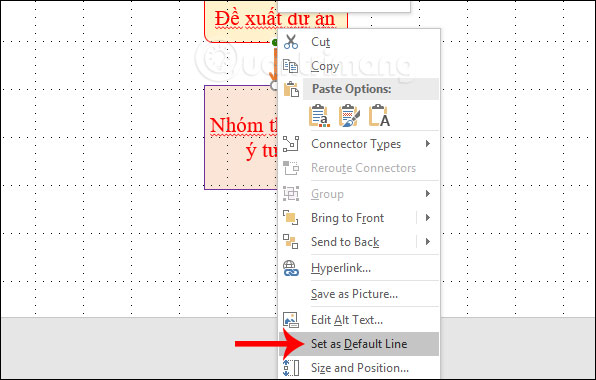
Finally we proceed to complete the flowchart. Particularly with the link arrow set as the default arrow, you just need to click on the arrow style and then go to the flowchart. The arrow format is available without any editing.

The steps of drawing PowerPoint diagrams are simple and not too complicated. Adjusting the shapes in the flowchart is similar to when you format regular shapes in a slide.
I wish you all success!
Was this article helpful?
Your feedback helps us improve.
Related Articles
 Instructions on how to draw diagrams in Word13 minutes read
 Instructions for creating charts on PowerPoint5 minutes read
 How to draw flow charts in Excel12 minutes read
 Instructions for displaying charts in powerpoint 20071 minutes read
 PowerPoint 2019 (Part 22): Charts8 minutes read
 Instructions for drawing charts with AI accurately and quickly2 minutes read
Reader Comments 0
Sign in with email or Google to join the discussion.