How to draw flow charts in Excel
There are many options available to create flowcharts (also known as flowcharts or flowchart), however, if you have registered Microsoft Office 365, this is not necessary. TipsMake.com has shown you how to create a map in Word, so what about Excel?
In this article, we will learn how to set up the flowchart environment and create flowcharts in Excel. Some links for readers to download free Microsoft Excel flow charts will be placed at the end of the article.
Instructions for creating flowchart in Excel
- Set up the flowchart grid in Excel
- Create a grid
- Activate Snap to Grid
- Set up page layout in Excel
- How to create flow charts in Excel
- Add a shape using the Shapes tool
- Add another shape to the flowchart using the Format tab
- Add text to the shape
- Add connection lines between shapes
- Add text to the link
- Add notes using annotations
- How to format flow charts in Excel
- Format images
- Format text in shapes and text boxes
- Format connection lines
- Excel storage templates
Set up the flowchart grid in Excel
When creating flow charts in Excel, there is a useful way to locate and set dimensions for elements in the flowchart.
Create a grid
To create a grid, users need to change the width of all columns equal to the default row height.
First, select all cells on the spreadsheet by clicking on the box in the upper left corner of the spreadsheet grid. Then right-click on any column header and select Column Width.

If using the default font ( Calibri, size 11), the default row height is 15 points , equivalent to 20 pixels . To make the column width equal to 20 pixels , change it to 2.14.
So enter 2.14 in the Column Width dialog box and click OK.

Activate Snap to Grid
The Snap to Grid features make it easy to set and resize shapes on a grid, so that they can be resized consistently and aligned to them equally.
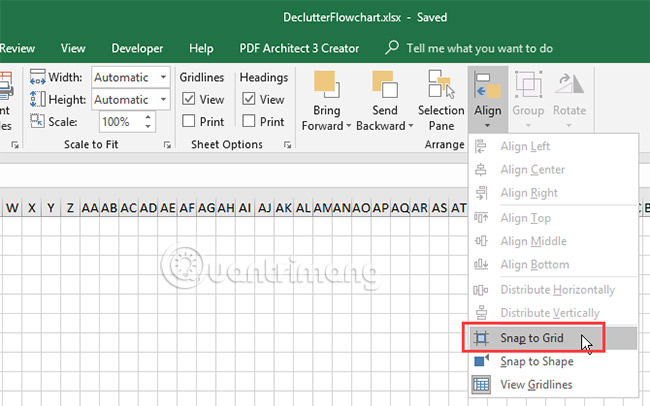
Click the Page Layout tab . Then, click Align in the Arrange section and select Snap to Grid . The Snap to Grid icon on the menu is highlighted in a gray box when enabled.
Set up page layout in Excel
Users should set up a page layout for their flowchart to know the boundary before placing the flowchart. For example, if you want to insert a flowchart into a Word document, set the page size in Microsoft Excel to match the Word document. That way, the user will create a flow chart equal to the size of the pages in the Word document.
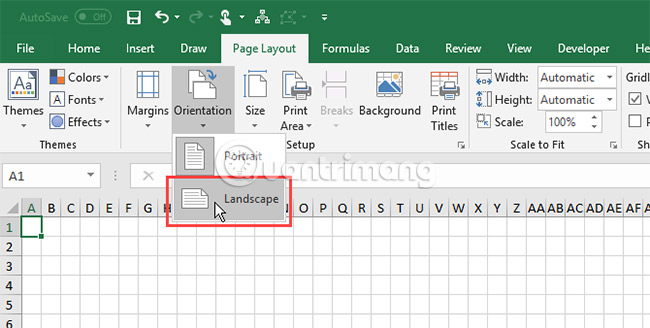
To set items like Margins , Page orientation and Page size , click the Page Layout tab . Use the buttons in the Page Setup section to change the settings for different layout options.
How to create flow charts in Excel
Now, the spreadsheet section has been set up for the flowchart. Let's start creating a flowchart as follows.
Add a shape using the Shapes tool
To add the first shape to the flowchart, go to the Insert tab and click Shapes in the Illustrations section . A drop-down menu displays a collection of different types of shapes such as basic shapes, lines and arrows.
Select an image in the Flowchart section of the drop-down menu.
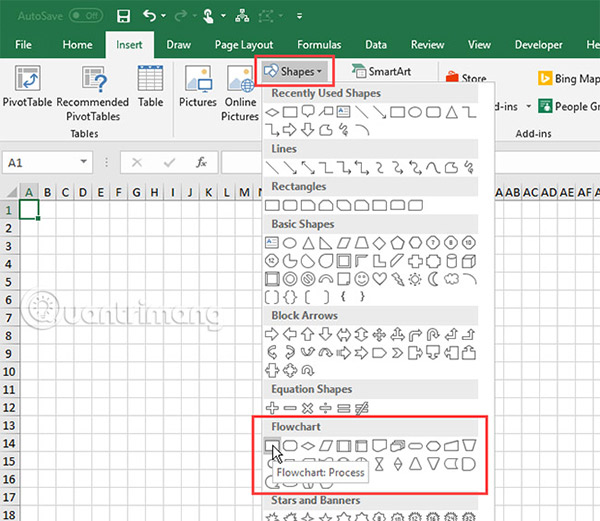
Drag the shape to increase the size as desired on the spreadsheet. If the Snap to Grid feature is enabled, the shape will automatically match the grid lines when the user draws it.

Add another shape to the flowchart using the Format tab
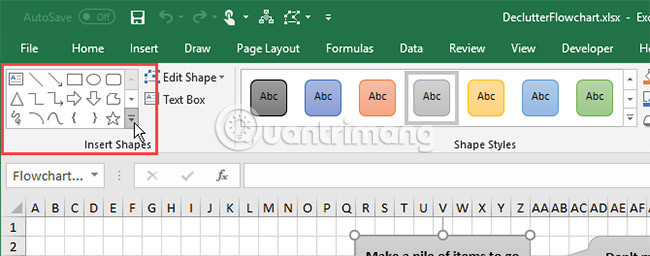
When the user draws his first shape and selects it, the Special Format tab will be available. Users can use this tab to add more shapes to their flowchart and format their shapes.
A shape collection will be displayed, just like when clicking Shapes in the Illustrations section on the Insert tab . Select the shape you want to add and draw it on the spreadsheet.
Users can also double-click an image on the menu to add it to the spreadsheet. To resize the shape, select it and drag one of the handle handles along the edges.
To move the shape, move the cursor back and forth until the cursor becomes a cross with an arrow. Then, click and drag the shape to the desired place.
Add text to the shape
To add text to a shape, just select the shape and start typing. Then, format and align this text.
To edit text in a shape, click on the text in that shape. This brings users into edit mode, allowing adding, changing or deleting text.
Click outside the shape or choose the same as when moving the shape in the previous section.
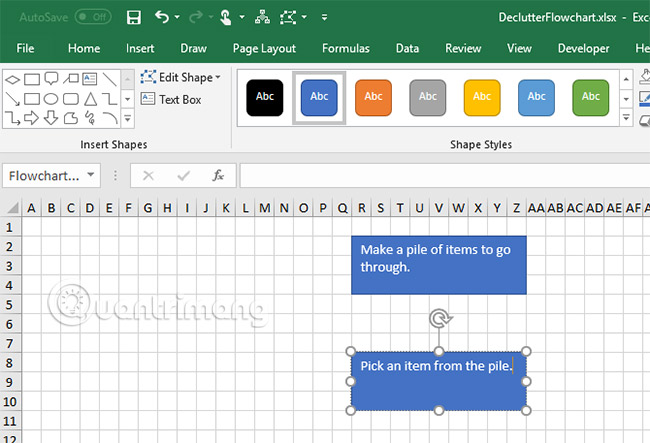
Add connection lines between shapes
After adding some shapes to the flowchart, it's time to connect them. Select Line Arrow on the Shapes library on the Insert tab or Format tab .
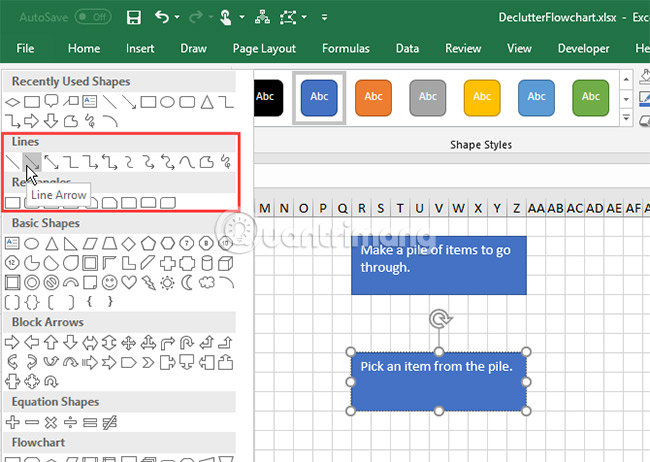
The pointer becomes a plus symbol. Move the cursor to the first shape you want to connect. Dots appear at points that can connect to that shape.
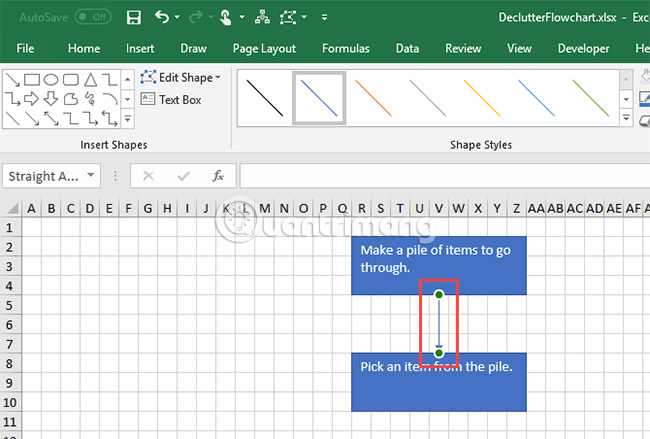
Click on the connection point where the line starts and drag the straight line to the next image, until you see the connection points on it appear. Release the mouse on one of those points.
An arrow shows where the connection ends. When a line is connected to the right shape, the connection point will not disappear. If you do not want to see the connection point, do not associate the shapes with the connector.
Add text to the link
In graph creation programs like Visio and Lucidchart, users can add text directly to the connection lines. In Microsoft Excel, users can also do that.
To add text to a connection, create a text box and place it along or on that connection line.
Select a shape or a connection to activate the Format tab . Click the tab and then click Text Box in the Insert Shapes section .
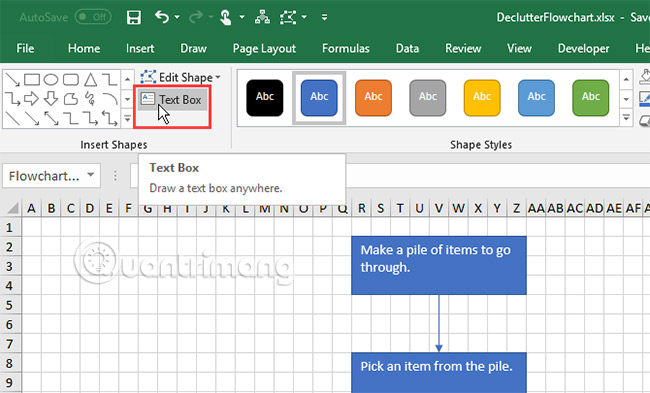
Draw a text box near the line you want to label. Move the text box to the desired position, just like moving the shapes in the flowchart.
You can turn off Snap to Grid when locating text boxes on links. This allows users to fine-tune the size and position of text boxes.
To add text, select the text box and start typing. The article will show you how to format and locate text boxes in the following section.

Add notes using annotations
Users can also use text boxes to add notes to their flowchart, the same way used to add text to links. And users can use a link to point to the area related to the note.
But, that can confuse the viewer because it looks like a step in the flowchart. To make a note look different, use a comment.
Select a caption from the Shapes library on the Insert tab or the Format tab .

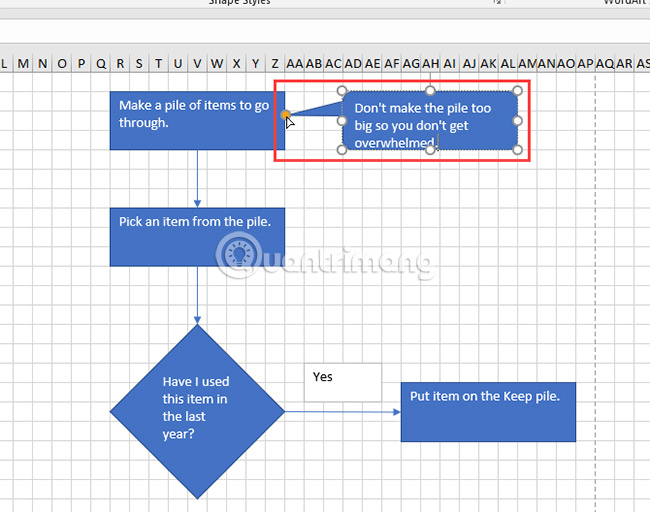
Draw captions on spreadsheets just like when drawing a shape in a flowchart.
Add text to annotations and use dots to resize.
Initially, a part of the annotation appears at the bottom edge. To create a comment point in the desired position, click and drag the point. When that point connects to a shape, the connection point will turn red.
How to format flow charts in Excel
Excel has many formatting options. But today's article will show you a few basic things, to be able to format your images, text and links.
Format images
An easy way to format images and text in shape is to use Theme Styles.
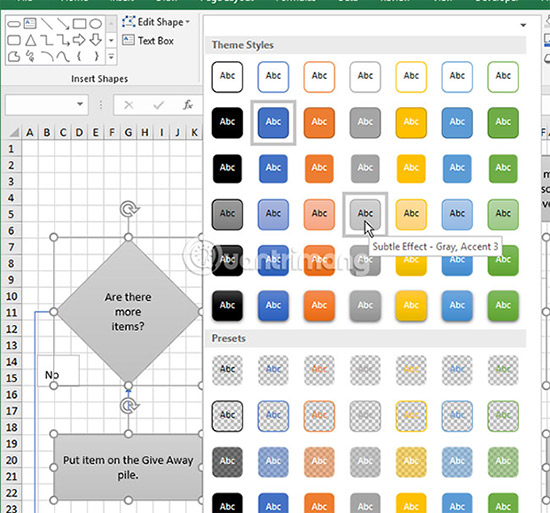
Select all shapes you want to format with the same style. Click on the first image, then press and hold Shift while clicking on other images. Then, click the Format tab .
Click the More arrow in the lower right corner of the Theme Styles box in the Shape Styles section . A collection of styles is displayed in the drop-down menu.
When hovering over different theme styles, users will see what they look like on the shape. Click on the type you want to use.
Format text in shapes and text boxes
Formatting text in shapes and text boxes is done in the same way as used to format text in cells.
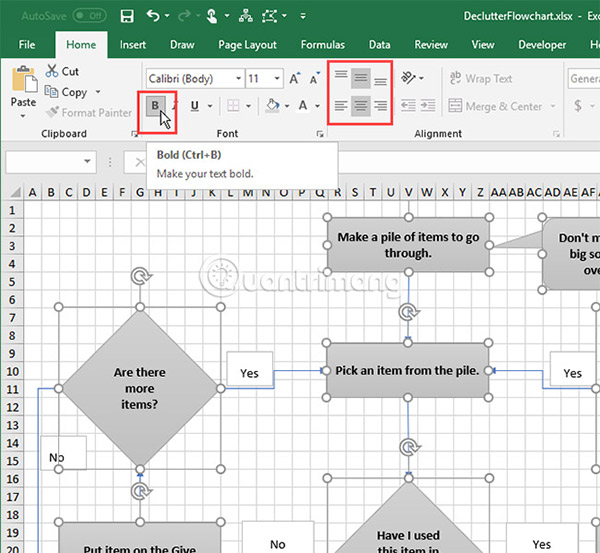
First, we will format the shape. Select all images containing the text you want to format, by holding down the Shift key while clicking on the images to select.
Click the Home tab and use the commands in the Font section and Alignment to format the text. For example, use the Center and Middle Align buttons in the Alignment section to center text in horizontal and vertical shapes. Then apply the Bold option for all text.
Do the same with text boxes along the links to format and align text.
Format connection lines
The default format on the connection lines is rather thin, so it should be thicker to make it easier to observe.
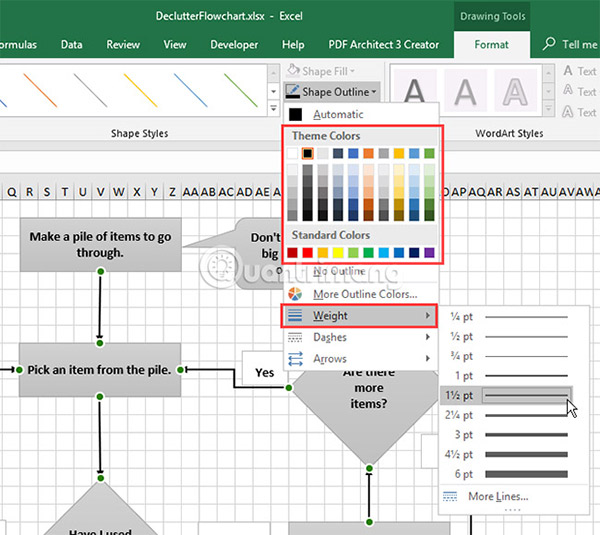
Select all connections that you want to format by holding down the Shift key . Then, click the Format tab .
Click Shape Outline in Shape Styles and select colors from the Theme Colors or Standard Colors section. Then, on the same menu, go to the Weight section and select the thickness for the links from the submenu.
Excel storage templates
Excel flowcharts are a quick start for users to create their own flowcharts. The following samples are exclusively for Microsoft Excel:
- Process Map for Basic Flowchart
- Sample Flow Chart Template in Microsoft Word, Excel | Template.net
- Flow Chart Template in Microsoft Word, Excel | Template.net
- 8+ Flowchart Templates - Excel Templates
- Editable Flowchart Templates For Excel
- 40 Fantastic Flow Chart Templates [Word, Excel, Power Point]: http://templatelab.com/flow-chart-template/
The flow charting capabilities in Microsoft Excel make it a very useful and flexible tool to keep things organized. However, this is not the only option. There are several good free flow creation tools available for Windows on the Internet.
Hope you are succesful.
See more:
- How to create SmartArt graphics in Excel
- Create Excel charts that automatically update data with these three simple steps
- How to draw charts in Excel