Use effects for tables and charts in PowerPoint
This article introduces you to how to use effects for tables and charts in PowerPoint 2016. After creating tables and charts, you make creating effects that appear for the following objects..
In this article, I introduce you how to use effects for tables and charts in PowerPoint 2016.

After creating the tables and charts, you can create the following effects for the objects. Usually the data table will appear before the chart:
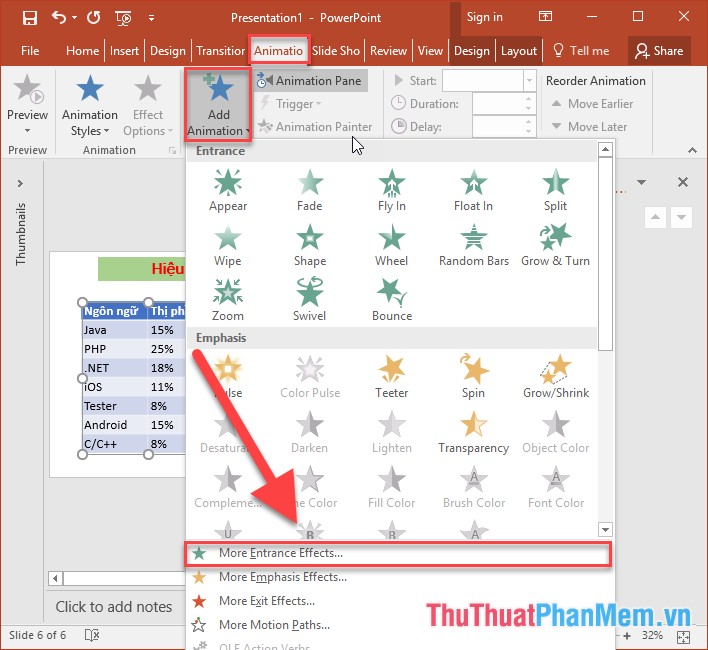
Select the table of data to create a chart on the Animations tab -> Add Animation -> select the effect type, for example here, first select the effect that appears for the table:
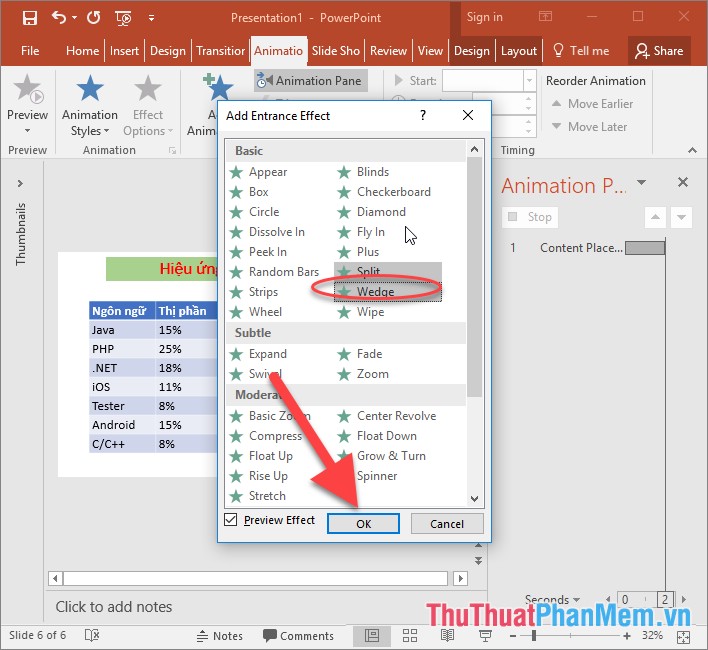
A dialog box appears that selects the appropriate effect:
Next need to emphasize the data on the board -> use additional Emphasis Effect:

You want more dynamic table content to be able to use additional effects to move the table from top to bottom:

Finally, you need to hide the data sheet to display the chart -> choose to add the disappearing effect in the Exit Effect group :

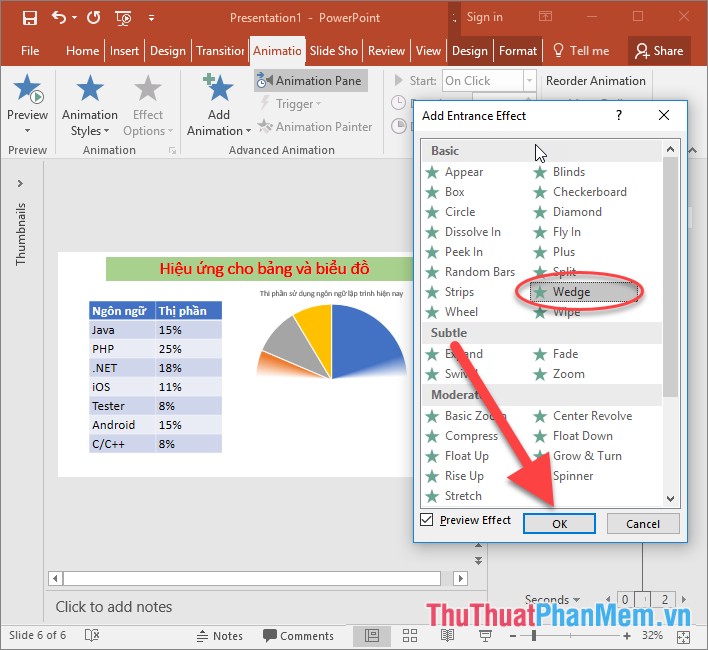
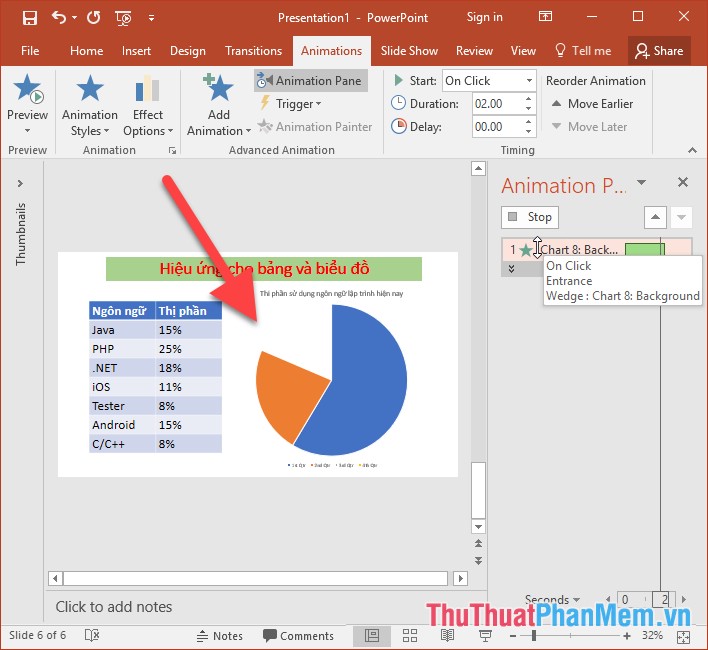
After the data sheet is hidden -> the chart is shown -> select the effect that appears for the chart:
With the chart with more effects appear each element in the chart is very convenient for you to show -> click Effect Options and select By Category:
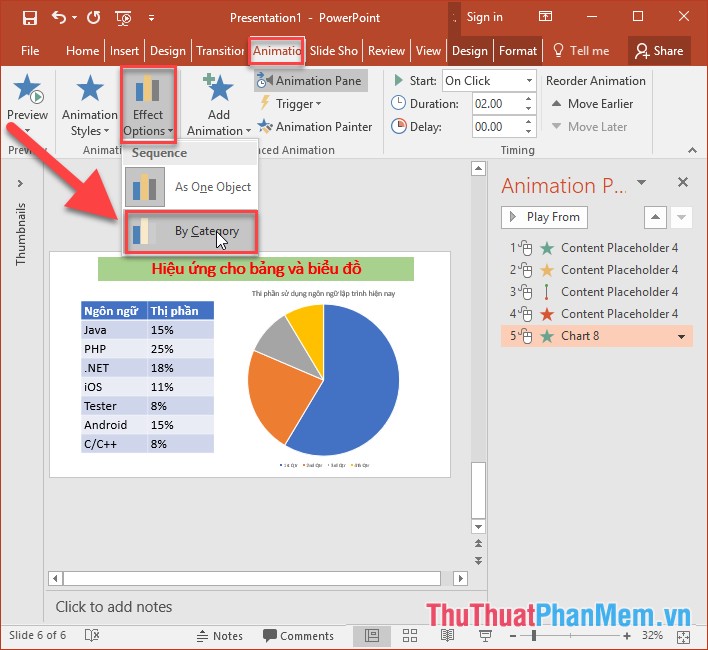
The results of each component in the chart are shown respectively:
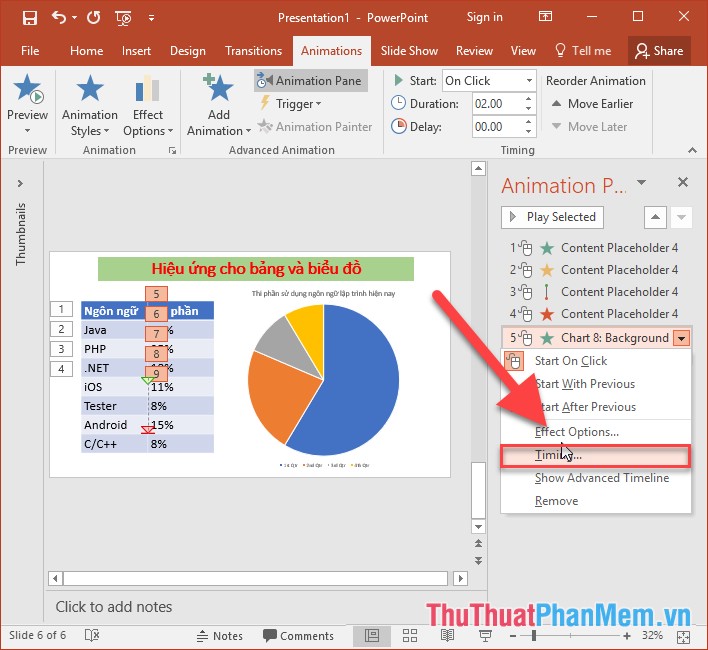
Also with charts and tables you can set up more advanced effects by right-clicking on the effect select Timing:
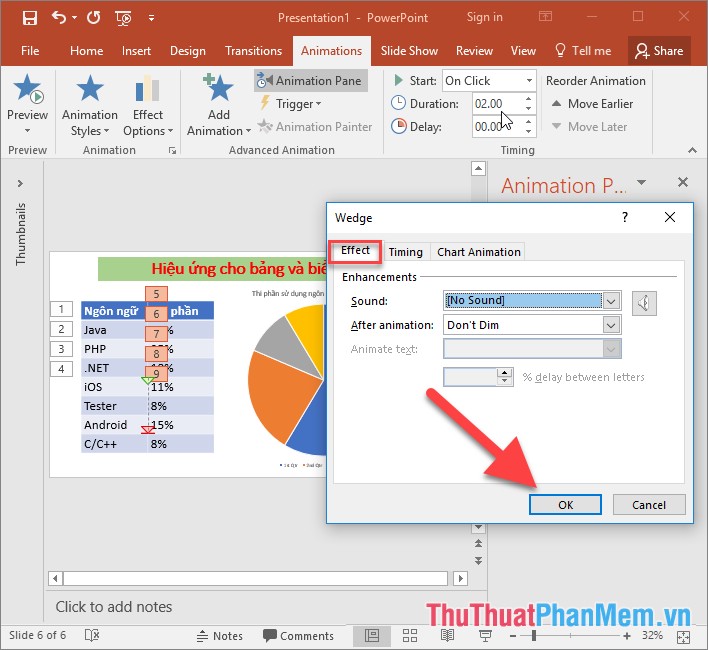
Adjust parameters such as how they appear, insert sound during the slideshow, effects after the slideshow….
Above is a detailed guide on how to use effects for tables and charts in PowerPoint 2016.
Good luck!