Statistical functions in Excel include conditional, time-based, and quantity-based functions.
You know, there are many statistical functions, such as COUNTIFS, RANK, COUNT, etc. Each of these functions has a different purpose. If you don't remember the formulas for these statistical functions, please refer to the list of Excel functions below.
Table of Contents
Statistical functions in Excel , as well as calculation and date functions, effectively support work and study for people of all ages today. However, understanding the names and syntax, and applying them to real-world problems, depends not only on each individual's skills but also on their own abilities.

A compilation of statistical functions in Excel 2016, 2013, 2010, and 2007.
Excel functions often have interrelated relationships. For example, logical functions can be combined with statistical functions to analyze data lists according to the requirements of a problem. In a previous article, TipsMake introduced a collection of very useful logical functions . In this article, we will continue to present statistical functions in Excel for our readers.
A compilation of statistical functions in Excel.
1. STATISTICAL FUNCTION GROUP
AVEDEV (number1, number2, .): Calculates the average absolute deviation of data points from their mean. Often used as a measure of the variability of a data set.
AVERAGE (number1, number2, .): Calculates the arithmetic mean.
AVERAGEA (number1, number2, .): Calculates the arithmetic mean of values, including logical values.
AVERAGEIF (range, criteria1): Calculates the arithmetic mean of values in an array based on a given condition.
AVERAGEIFS (range, criteria1, criteria2, .): Calculates the arithmetic mean of values in an array based on multiple conditions.
COUNT (value1, value2, .): Counts the number of cells in a list.
COUNTA (value1, value2, .): Counts the number of cells containing non-empty values in a list.
COUNTBLANK (range): Counts the number of empty cells in a range.
COUNTIF (range, criteria): Counts the number of cells that meet a given condition within a range. In fact, the COUNTIF function is one of the most frequently used conditional statistical functions in Excel. Therefore, interested readers can find and refer to information, instructions, and tips on using this function in the article " COUNTIF Conditional Counting Function in Excel" that TipsMake previously published.

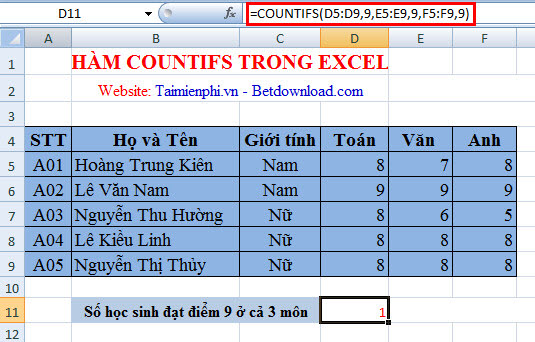
COUNTIFS (range1, criteria1, range2, criteria2, …): Counts the number of cells that meet several given conditions.
DEVSQ (number1, number2, .): Calculates the squared deviations of data points from their sample mean, then adds those squares together.
FREQUENCY (data_array, bins_array): Calculates how many values frequently appear within a range of values, then returns a vertical array of numbers. Always use this function as an array formula.
GEOMEAN (number1, number2, .): Returns the geometric mean of a range of positive numbers. Often used to calculate average growth, where compound interest has given variable interest rates…
HARMEAN (number1, number2, .): Returns the harmonic mean (inverse of the arithmetic mean) of numbers.
KURT (number1, number2, .): Calculates the kurtosis of a data set, indicating the relative kurtosis or flatness of a distribution compared to a normal distribution.
LARGE (array, k): Returns the k-th largest value in a data set.
MAX (number1, number2, .): Returns the largest value in a set of values. Along with calculating the largest value, we can also use the MIN function to calculate the smallest value. Refer to the article on Max and Min functions in Excel for more information on calculating the largest and smallest values in Excel.

MAXA (number1, number2, .): Returns the largest value in a set of values, including logical and text values.
MEDIAN (number1, number2, .): Calculates the median of the numbers.
MIN (number1, number2, .): Returns the smallest value in a set of values.
MINA (number1, number2, .): Returns the smallest value in a set of values, including logical and text values.
MODE (number1, number2, .): Returns the most frequently occurring value in an array of values.
PERCENTILE (array, k): Finds the k-th percentile of the values in a data array.
PERCENTRANK (array, x, significance): Returns the rank (relative position) of a value in a data array, which is the percentage of that data array.
PERMUT (number, number_chosen): Returns the permutation of objects.
QUARTILE (array, quart): Calculates the quartile of a data set. Often used in data analysis to divide sets into groups…
RANK (number, ref, order): Calculates the rank of a number in a list of numbers; the RANK function is frequently used when users need to rank their data. Refer to the article on using the RANK function for ranking in Excel for more information.

SKEW (number1, number2, .): Returns the standard deviation of the distribution, describing the degree of asymmetry of the distribution around its mean.
SMALL (array, k): Returns the k-th smallest value in a set of numbers.
STDEV (number1, number2, .): Estimates the standard deviation based on the sample.
STDEVA (value1, value2, .): Estimates the standard deviation based on the sample, including logical values.
STDEVP (number1, number2, .): Calculates the standard deviation for the entire population.
STDEVPA (value1, value2, .): Calculates the standard deviation for the entire population, including text and logical values.
VAR (number1, number2, .): Returns the variance based on the sample.
VARA (value1, value2, .): Returns the variance based on the sample, including logical values and text.
VARP (number1, number2, .): Returns the variance based on the entire population.
VARPA (value1, value2, …): Returns the variance based on the entire set, including logical and text values.
TRIMMEAN (array, percent): Calculates the inner mean of a dataset by excluding the percentages of data points at the beginning and end of the dataset.
2. FUNCTIONS FOR PROBABILITY DISTRIBUTIONS
BETADIST (x, alpha, beta, A, B): Returns the value of the cumulative probability density function beta.
BETAINV (probability, alpha, beta, A, B): Returns the inverse of the cumulative probability density function beta.
BINOMDIST (number_s, trials, probability_s, cumulative): Returns the probability of successful trials of a binary distribution.
CHIDIST (x, degrees_freedom): Returns the one-sided probability of a chi-squared distribution.
CHIINV (probability, degrees_freedom): Returns the inverse of the one-sided probability of a chi-squared distribution. While not everyone uses the CHIINV function, it's a useful tool for calculating the inverse of a probability .

CHITEST (actual_range, expected_range): Returns the probability value from a chi-squared distribution and the corresponding number of degrees of freedom.
CONFIDENCE (alpha, standard_dev, size): Calculates the confidence interval for a theoretical expectation.
CRITBINOM (trials, probability_s, alpha): Returns the smallest value such that the cumulative binomial distribution is greater than or equal to the standard value. Often used to ensure applications meet quality standards…
Time-dependent statistical function EXPONDIST (x, lambda, cumulative): Calculates the exponential distribution. Often used to model the time between events…
FDIST (x, degrees_freedom1, degrees_freedom2): Calculates the probability distribution F. Often used to determine whether two sets of data have significantly different levels…
FINV (probability, degrees_freedom1, degrees_freedom2): Calculates the inverse of the probability distribution F. Often used to compare the variability in two sets of data.
FTEST (array1, array2): Returns the result of an F-test. Often used to determine whether two samples have different variances…
FISHERINV (y): Calculates the inverse of the Fisher transform. Often used to analyze the correlation between data sets…
GAMMADIST (x, alpha, beta, cumulative): Returns the cumulative gamma distribution. Can be used to study skewed distributions.
GAMMAINV (probability, alpha, beta): Returns the inverse of the cumulative gamma distribution.
GAMMLN (x): Calculates the natural logarithm of the gamma function .
HYPGEOMDIST (number1, number2,.): Returns the hypergeometric distribution (probability of a certain number of successes…).
LOGINV (probability, mean, standard_dev): Calculates the inverse of the lognormal cumulative distribution of x (LOGNORMDIST). When calculating the log-normal cumulative distribution, we will use the LOGINV function because it is the best tool for this purpose.

LOGNORMDIST (x, mean, standard_dev): Returns the lognormal cumulative distribution of x, where the natural logarithm of x is normally distributed with parameters mean and standard_dev.
NEGBINOMDIST (number_f, number_s, probability_s): Returns the negative binomial distribution (returns the probability that there will be number_f failures before there will be number_s successes, when the constant probability of a success is probability_s).
NORMDIST (x, mean, standard_dev, cumulative): Returns the normal distribution. Often used in statistics, including hypothesis testing :
NORMINV (probability, mean, standard_dev): Calculates the inverse of the standard normal cumulative distribution.
NORMSDIST (z): Returns the standard normal cumulative distribution function, which is a distribution with a mean of zero (0) and a standard deviation of 1.
NORMSINV (probability): Calculates the inverse of the standard normal cumulative distribution function .
POISSON (x, mean, cumulative): Returns the Poisson distribution. These are time-series statistical functions commonly used to estimate the number of events that will occur within a given time period.
PROB (x_range, prob_range, lower_limit, upper_limit): Calculates the probability of values in the range falling between two limits. STANDARDIZE
( x, mean, standard_dev): Returns the normalized value from the distribution represented by mean and standard_dev.
TDIST (x, degrees_freedom, tails): Returns the probability of the Student's t-distribution, where x is the value derived from t and used to calculate the probability.
TINV (probability, degrees_freedom): Returns the t-value of the Student's t-distribution.
TTEST (array1, array2, tails, type): Calculates the probability associated with the Student's t-test.
WEIBULL(x, alpha, beta, cumulative): Returns the Weibull distribution. Often used in reliability analysis, such as calculating the average lifespan of a device.
ZTEST (array, x, sigma): Returns the one-sided probability of the z-test.
These are statistical functions in Excel. Hopefully, this article will help you in using Microsoft Excel. Wishing you effective learning and use of Excel!
Microsoft has released Microsoft Office 2016. This office suite has been updated with many useful features. It helps create spreadsheets, perform calculations, compile statistics, and balance income and expenses for businesses, organizations, and even large corporations.
Was this article helpful?
Your feedback helps us improve.
Related Articles
 How to use conditional statistical functions in Excel8 minutes read
 6 Conditional Functions That Make Excel Spreadsheets Smarter8 minutes read
 How to format data based on other cell conditions in Excel3 minutes read
 Ms Excel - Lesson 13: Use conditional formatting in Excel2 minutes read
 MS Excel 2003 - Lesson 13: Using conditional formatting in Excel2 minutes read
 How to use conditional formatting in Microsoft Excel 20169 minutes read
Reader Comments 0
Sign in with email or Google to join the discussion.