How to use conditional statistical functions in Excel
How to use conditional statistical functions in Excel. Statistical data is an important step to help you plan your business process. In the calculation process you cannot help but use the quick statistical functions in Excel.
Table of Contents
Statistical data is an important step to help you plan your business process. In the calculation process you cannot help but use the quick statistical functions in Excel. In this article, you will learn about statistical functions.

1. Conditional average function
With conditional average function, there are 2 types:
- Calculate the average with 1 condition: Averageif
- Calculate the average with many events: Averageifs
a) Averageif function
Meaning: The function performs the arithmetic mean of numerical values in a given data area under a certain condition.
Syntax: Averageif (Range, Criteria, Average_range)
Inside:
- Range: The data area contains the conditions for calculating the average value.
- Criteria: The condition for calculating the average value, can be the address box containing the condition or directly enter the condition in the formula.
- Average_range: The data area contains the values to calculate the average value according to conditions.
Attention:
- The value to calculate the average must be a numerical value.
- If the conditional expression is not in the database => the function returns the # DIV / 0 error value!
- In the conditional expression that contains alternative characters such as? and * you need to put a ~ sign before the conditional expression.
For example:
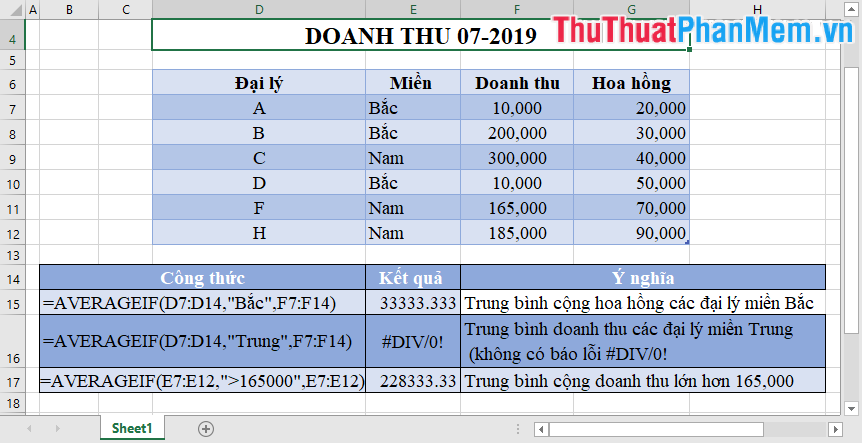
If the data range for the average is not a numeric data type -> Excel does not issue a message asking you to re-enter the data.

b) Averageifs function
Meaning: The function performs the arithmetic mean of given numeric values in the data area that satisfy more than one condition.
Syntax: AVERAGEIFS (average_range, criteria_range1, criteria1, criteria_range2, criteria2, .)
Inside:
- Average_range: The data area contains the values to calculate the average value according to conditions.
- Criteria1, criteria2: The condition for calculating the average value, can be the address box containing the condition or directly enter the condition in the formula, up to 127 conditions.
- Criteria_range1, criteria_range2: The data area contains conditions corresponding to Criteria1, criteria2 . corresponding to a maximum of 127 condition areas.
Attention:
- The value to calculate the average must be a numerical value.
- If the conditional expression is not in the database => the function returns the # DIV / 0 error value!
- In the conditional expression that contains alternative characters such as? and * you need to put a ~ sign before the conditional expression.
For example:

Notice the conditions in the form of calculation expressions or characters are in quotation marks.
2. Conditional counting function
a) The Countif function
Meaning: Counts the number of cells that meet 1 condition in the range.
Syntax: Countif (range, criteria)
Inside:
- range: The data area containing the data to count or statistics.
- criteria: Counting conditions.
Attention:
- When you use commas to separate the thousands in numeric data, pay attention when writing conditions that you write the correct comma values in the data table.
For example:

b) Countifs function
Meaning: Counts the number of cells that meet more than 1 condition in the specified data area.
Syntax: Countif (criteria_range1, criteria1, criteria_range2, criteria2, .)
Inside:
- criteria_range1, criteria_range2, .: The data area containing the conditions to be counted.
- criteria1, criteria2, .: The condition corresponds to the data regions criteria_range1, criteria_range2, .
For example:

3. The function finds the maximum, minimum, conditional values
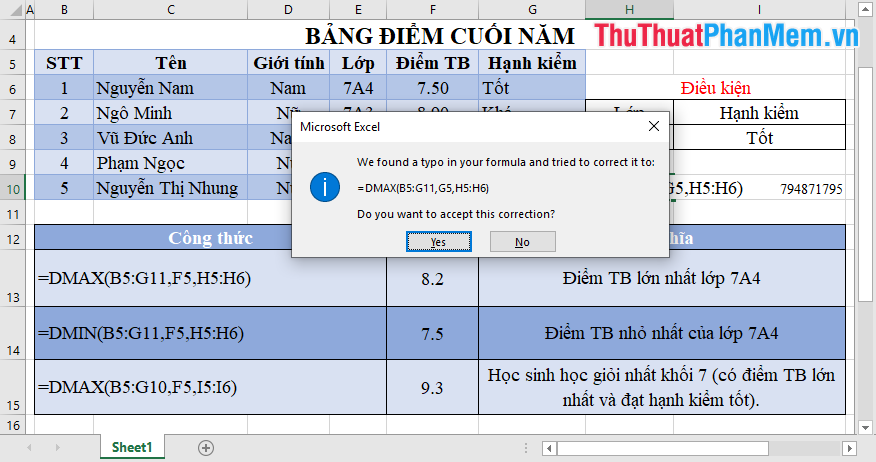
a) Dmax function
Meaning: The Dmax function returns the maximum value in a data range with a given condition.
Syntax: = DMAX (database, field, criteria)
Inside:
- database: list or related database including column headers. If the database does not contain a column header, the result will be incorrect.
- field: the field (column) needs to get the maximum value. You can enter the column header directly in quotation marks or some representing the column position in the database: 1 for the first column, 2 for the second column, etc., you can also enter the cell containing the required column header. Using example B3, C1 .
- criteria: is the range of cells that contain conditions, you can choose any as long as the range contains at least one column header and the cell below the column header contains conditions for the column in which the column header coincides with the title. column in the data table.
Notes :
- You should set the criteria range on the worksheet so that when adding data, the range of conditions does not change.
- The scope of the conditions that need to be separated is not inserted into the list or database to be processed.
- Criteria must contain at least column headers and a cell containing conditions under column headers.
b) Dmin function
Meaning: The Dmin function returns the smallest value in a data range with a given condition.
Shot law : = DMIN (database, field, criteria)
Inside:
- database: list or related database including column headers. If the database does not contain a column header, the result will be incorrect.
- field: the field (column) needs to get the maximum value. You can enter the column header directly in quotation marks or some representing the column position in the database: 1 for the first column, 2 for the second column, etc., you can also enter the cell containing the required column header. Using example B3, C1 .
- criteria: is the range of cells that contain conditions, you can choose any as long as the range contains at least one column header and the cell below the column header contains conditions for the column in which the column header coincides with the title. column in the data table.
Notes :
- You should set the criteria range on the worksheet so that when adding data, the range of conditions does not change.
- The scope of the conditions that need to be separated is not inserted into the list or database to be processed.
- Criteria must contain at least column headers and a cell containing conditions under column headers.
For example:

The Dmax function gives the largest numeric value in the data field so if the value is not numeric data -> Excel requires you to re-enter the data.
The above article introduces you to using some conditional statistical functions in Excel hoping to help you. Good luck!
Was this article helpful?
Your feedback helps us improve.
Related Articles
 Statistical functions in Excel include conditional, time-based, and quantity-based functions.11 minutes read
 6 Conditional Functions That Make Excel Spreadsheets Smarter8 minutes read
 The IF function in Excel: Syntax and specific examples of the IF function.5 minutes read
 The syntax and function of each function in the group of statistical functions in Excel15 minutes read
 COUNTIF function: Conditional counting in Excel8 minutes read
 The MIN and MAX functions (the smallest and largest value functions) in Excel3 minutes read
Reader Comments 0
Sign in with email or Google to join the discussion.