Common statistical functions in Excel
Summary of common statistical functions in Excel.
Summary of common statistical functions in Excel
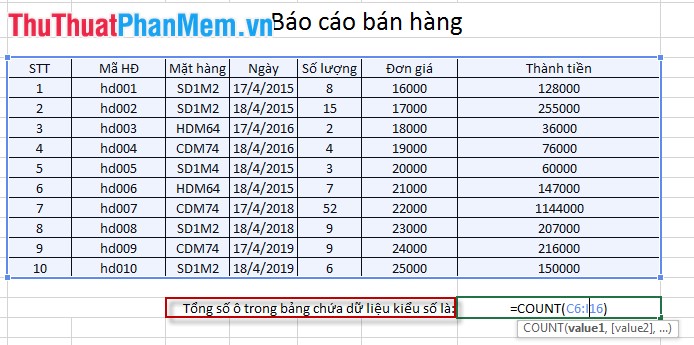
1. Function Count - Count data numeric
- Syntax: Count (data area to be counted).
- Meaning: Used to count the total number of cells containing numeric values.
- For example:
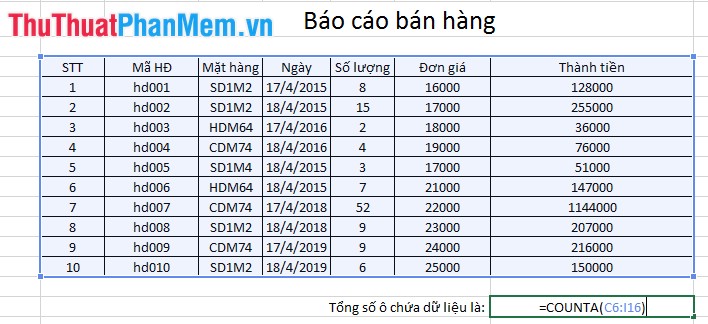
2. Counta function - Count all cells containing data (other than counting cells with numeric data)
- Syntax: Counta (data area to be counted).
- For example:
3. Countif function - The function counts data according to one condition
- Syntax: Countif (data area containing search values, search conditions).
- The function can count up to 127 conditions.
- Example: Calculating the total of items sold on April 18, 2015.

4. Countifs function
- Syntax: Countifs (data area condition 1, condition 1, data area condition 2, condition 2, . .).
- Example: Calculating the total number of items sold on April 18, 2015 with unit price = 17000

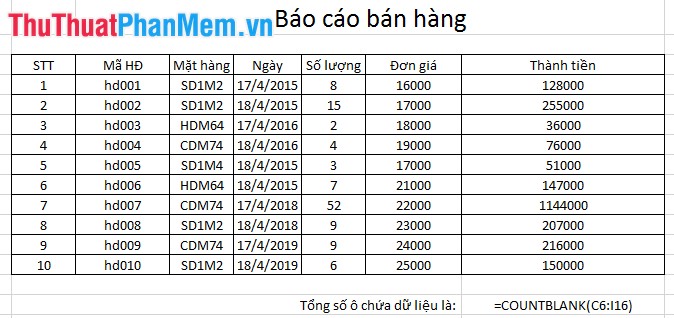
5. Countblank function - Count the number of empty cells in a table (note that the value 0 is not an empty value)
- Syntax: Countblank (data area to be counted).
- For example:
6. The Rank function
- You want to know the total score of your test position in the ranking you use the rank function offline.
- Syntax: Rank (value to sort, data range to sort, sort type).
Inside:
Sort type has 2 values:
+ value = 0 sorted by descending style.
+ value = 1 sort by ascending.
- For example: Find out what the best selling HGSD item is among the items.
Thread analysis:
+ Based on the number of sold products to calculate the best selling item among the items.
+ Check the selling value of the item "HGSD" by the 7th in the number column. This order is the order number of the best seller.

7. Average function - The function calculates the average value
- Syntax: Average (value 1, value 2, value 3, . .).
- Example: Calculate the average unit price of items.
- Topical analysis: Calculate the average unit price of items we calculate the average value of the cells in the unit price column.

8. Column and Columns functions
Very useful application in excel file containing big data.
- Column function: Used to determine how much this cell is in the table in the table.
+ Syntax: Column (cell address to determine which column belongs).
+ Column order is calculated from the first column (column A) in excel.
+ For example:

- Columns function: Count the total number of columns in a data area.
+ Syntax: Columns (data area needs to determine number of columns)
+ For example:
