HTML Web Storage API
Web hosting is more secure, and large amounts of data can be stored locally without impacting website performance.
Fix Windows problems, troubleshoot devices, understand AI, secure your accounts and get more from your technology with tested step-by-step guides.
Web hosting is more secure, and large amounts of data can be stored locally without impacting website performance.

If you're struggling with video formats, converting videos to different formats can be difficult and time-consuming.

Use the HTML5 video element to embed MP4 and WebM video, add playback controls and captions, and handle autoplay and browser compatibility correctly.

Understand what HTML does, how elements and tags work, and how the doctype, head, and body form a basic web page.
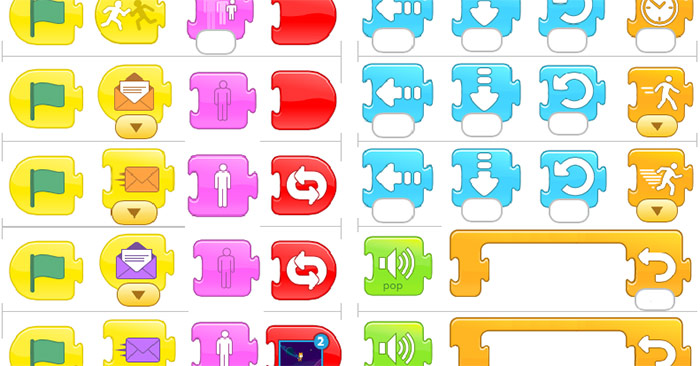
Learn how ScratchJr's wait, speed, repeat, stop, forever, and page-change blocks control the timing and flow of an animation.
Create the first question in a ScratchJr quiz, add tappable answer characters, and send the correct answer to the next page.
Design custom question and answer characters, then use color-coded ScratchJr messages to show, hide, and advance quiz questions on one page.
Create a tappable Play button, reveal the quiz with a message, and show a closing character when the final ScratchJr question is answered.
Draw a maze as a custom ScratchJr character, reset the player after wall collisions, and add a goal that ends the game.
Finish a ScratchJr maze with a welcome page, animated start prompt, win page, and controls to replay the game or return home.

Use AND, OR, and NOT in a SQL WHERE clause, understand operator precedence, and group mixed conditions safely with parentheses.

Understand what DROP DATABASE removes, how syntax differs across database systems, and which safety checks to complete before running it.
See where C++ is especially useful, what skills it teaches, and when another language may be a better first choice for your goals.
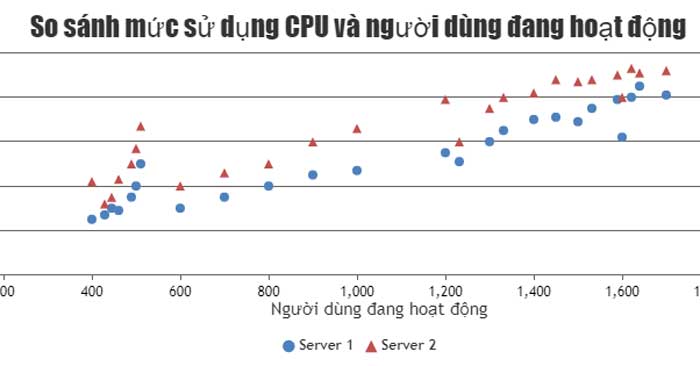
Build a multi-series CanvasJS scatter plot, assign circle and triangle markers, and customize marker size, color, and borders.
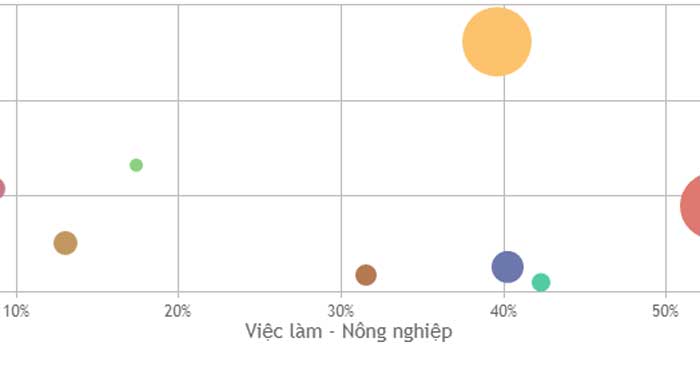
Build a CanvasJS bubble chart with x, y, and z values, then enable zooming, panning, reset controls, and readable tooltips.
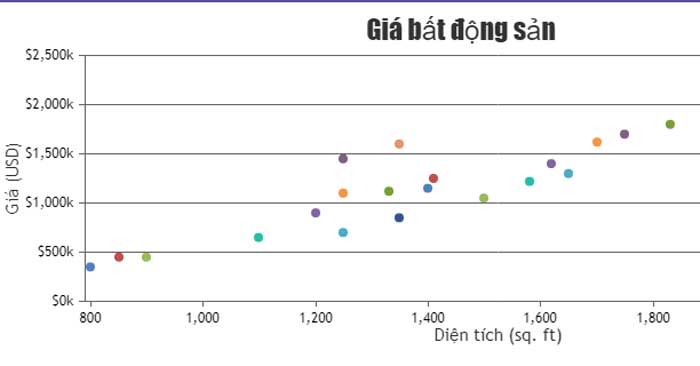
Create a basic CanvasJS scatter plot from x and y values, add axes and tooltips, and configure markers, zooming, and responsive sizing.
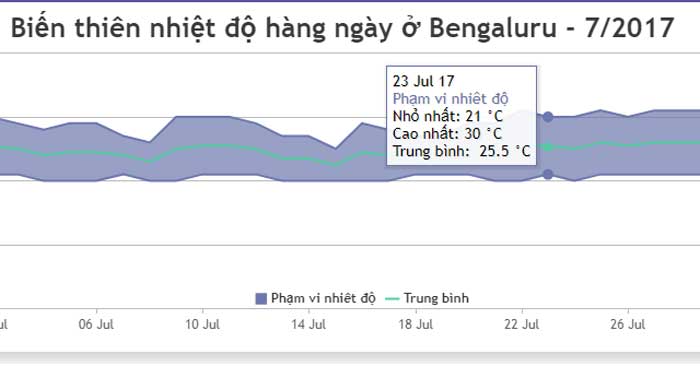
Use CanvasJS to display low-to-high ranges as a shaded area and overlay an average line on the same date axis.
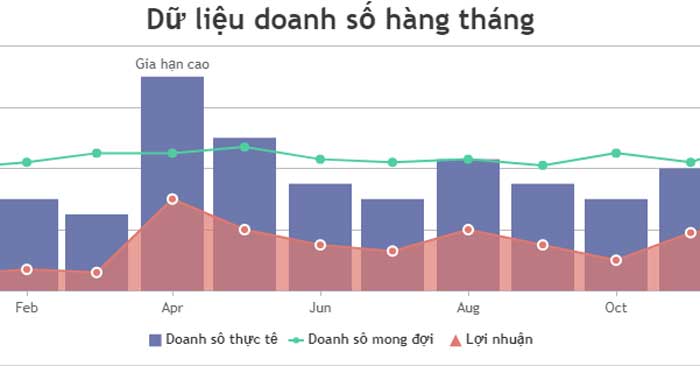
Build a CanvasJS mixed chart that compares current values as columns, earlier values as an area, and a target as a line.