JavaScript code to create a zoomable chart with Zoom & Pan functionality.
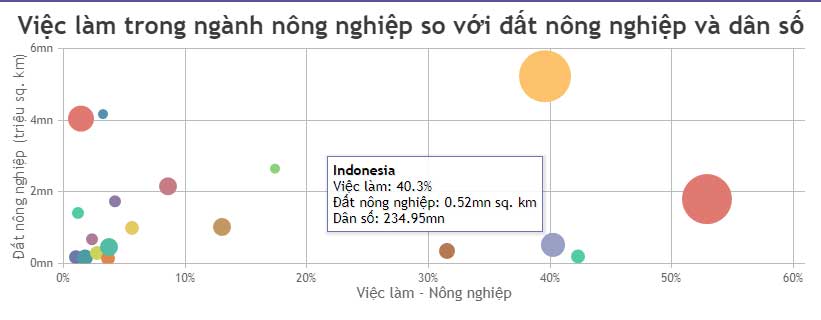
The example below illustrates a bubble chart template created using JavaScript that features chart zoom and rotation capabilities..
Like other chart templates in CanvasChart, bubble charts support zoom and pan functionality. Zooming is useful when there are a large number of data points in the chart. You can also navigate through the chart/graph after zooming in using the pan feature.
The example below illustrates a bubble chart template created using JavaScript that includes zoom and rotation features . The article also includes the JavaScript source code for you to edit in your browser or save to your computer for local execution.
Source: CanvasJS
Customize charts
You are free to adjust the properties in the JavaScript code that creates the bubble chart to get the desired result. For example:
- Turn on Zoom and Pan using
zoomEnabled. - Zoom in/out along the X-axis, Y-axis, or both axes using
zoomType. - Open the toolbar using
toolbar. - Change the color using
color. - Adjust the opacity when filled using
fillOpacity. - The border color is indicated by
markerBorderColor. - The thickness of the border is indicated by
markerBorderThickness.