MS PowerPoint 2007 - Lesson 8: Insert tables in PowerPoint
How to insert a table into PowerPoint is as simple as when you perform table insertion on Word or create tables in Excel.
Table of Contents
When presenting slides on PowerPoint, users can insert tables to make statistics easier. In addition to inserting graphs on PowerPoint, we can insert tables into PowerPoint in case we want to represent certain metrics.
Similar to Word or Excel office tools, PowerPoint also provides full features for presenting data or formatting content, including inserting tables into PowerPoint. Creating this table will be responsible for performing certain statistics more efficiently, faster than you have to explain and present more content.
Basically, manipulating PowerPoint tables is generally similar to inserting tables into Word, or creating tables on Excel. We also do with the Insert tab and the Table option, along with options for editing the format for the data table. More specific steps to insert a PowerPoint table will be guided by the Network Administrator in the article below.
- How to insert text into images in PowerPoint
- MS PowerPoint - Lesson 10: Slide presentation effects
- Fix 6 common errors on PowerPoint slides
How to insert tables in Excel
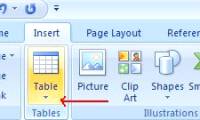
Step 1:
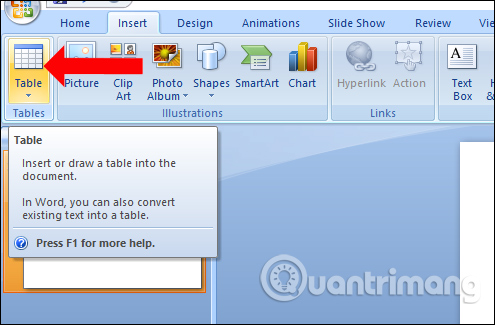
If you open the presentation, you want to insert the table into the content and then click the mouse at the place where you want to insert the table. Next, click on the Insert tab and then select the Table item to proceed with creating the table.
Step 2:
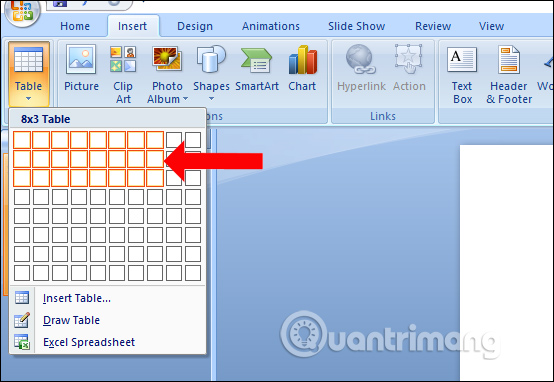
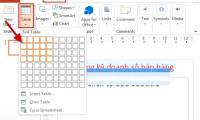
The options to create a table include:
- Hover select the number of lines the column wants to create.
- Insert Table: Enter the number of lines of columns you want to create in the Insert Table dialog box.
- Click Draw Table: K create the table.
- Excel Spreadsheet: Enter the data sheet from Excel.
If your table doesn't have many cells, just hover your mouse over the number of rows and columns to create the table quickly.
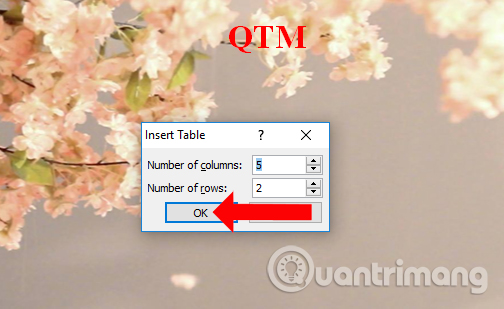
In case you want to customize the number of columns and rows in the table, click Insert Table and then enter the column and row numbers, click OK to create.
So we will get the table on the PowerPoint slide as shown below.

Step 3:
After inserting a table into PowerPoint, we can enter the content into the table or make edits to the table, structure and format for the table.
When you click on the table, users will come to Table Tools setup group. Here when you click on the Layout tab you will see a group of Rows & Columns and Merge to edit the table structure.

Step 4:
In the Rows & Columns group , we will have some set of PowerPoint data sheet structures including:
- Insert Above: Insert a line above the first line.
- Insert Below: Insert a line below the last line.
- Insert Left: Insert column to the left of the column.
- Insert Right: Insert a line to the right of the line.
- Delete: Delete selected rows, columns, and tables.

Step 5:
Next click on the Merge group and there will be 2 options:
- Merge Cells: Mix multiple cells into one box.
- Split Cells: Split cells into multiple cells.

Step 6:
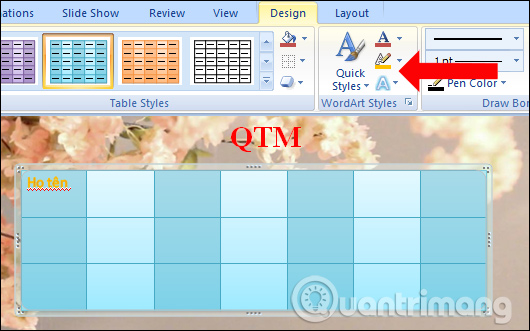
Next, the user will proceed to reformat the table when clicking on the Design tab above.
In Table Styles , you can select the colors for the table with different styles. Want to expand Table Styles to choose, users click on the 3rd arrow as shown below. Immediately the table will be expanded.

Step 7:
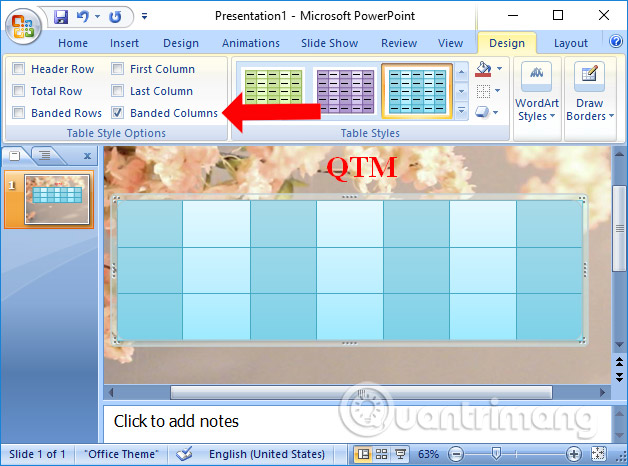
Next in the Table Style Options group, you will have customizations including:
- Header Row: Highlight the first row to distinguish in the table.
- Total Row: Highlight the last row to distinguish.
- Banded Rows: Highlights the rows in the same color table.
- First Column: Highlight the first column in the table.
- Last Column: Highlight the last column in the table.
- Banded Columns: Highlight columns in the same color table.
Step 8:
Next in the Word Art Styles group , we can change the effect for the content of the input in the table, including:
- Text Fill: Change the color of the text in the table.
- Text Outline: Add an Outline to the text and change that color, width, and type of Outline.
- Text Effects: Add special effects like shadow, reflection.
- Quick Styles: WordArt styles apply to selected text in tables.
Step 9:
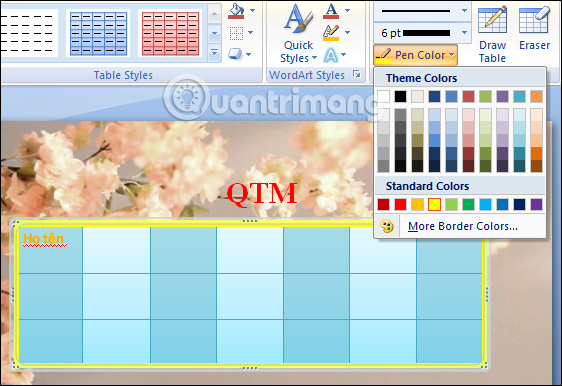
Finally, at the Draw Borders setup group, add the surrounding border styles of the table, including:
- Pen Style: The style of the tablet for the table.
- Pen Weight: The thickness of the border.
- Pen Color: The color of the table border.
- Draw Table: Add new rows, columns, cells to the current table, divide the current cells, columns, rows and draw new blank tables.
- Eraser. Delete the created border.
So you have completed the operations of creating a table on PowerPoint, as well as changing the table layout and formatting for the table. In general, creating tables on PowerPoint presentations is basically the same, not too complicated.
Video tutorial to create a table on PowerPoint
See more:
- Create beautiful slides for PowerPoint presentations with 8 tips
- Instructions to remove background images with PowerPoint 2010
- How to blur the background image in PowerPoint
I wish you all success!
Was this article helpful?
Your feedback helps us improve.
Related Articles
 PowerPoint 2019 (Part 21): Tables6 minutes read
 MS Word - Lesson 8: Creating a table2 minutes read
 Add tables to slides in PowerPoint3 minutes read
 MS PowerPoint 2007 - Lesson 5: Format text in PowerPoint9 minutes read
 How to insert images below the word on PowerPoint3 minutes read
 How to insert videos into PowerPoint 20167 minutes read
Reader Comments 0
Sign in with email or Google to join the discussion.