Add graphs to slides in PowerPoint
Introduce how to add graphs to slides in PowerPoint. 1. Create a chart. Step 1: Go to the Insert - Chart tab: Step 2: A dialog box appears to select the type of chart you want to create - click OK
Table of Contents
The following article introduces you in detail how to add graphs to Slide in PowerPoint.
1. Create a chart.
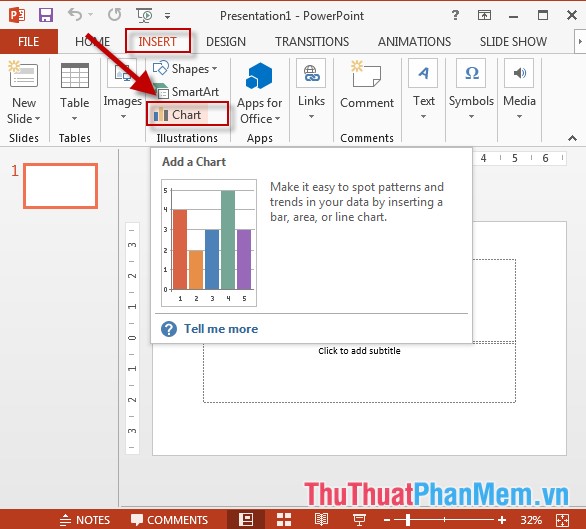
Step 1: Go to the Insert tab -> Chart:
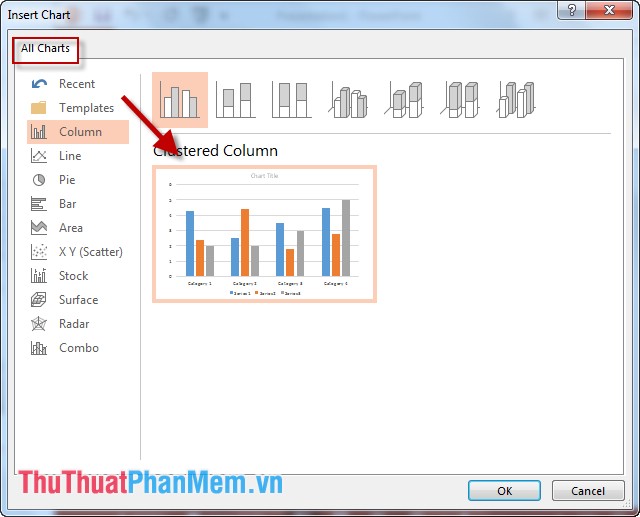
Step 2: The dialog box appears select the type of chart you want to create -> click OK:
Step 3: After selecting the chart type, enter the data you need to create the chart:
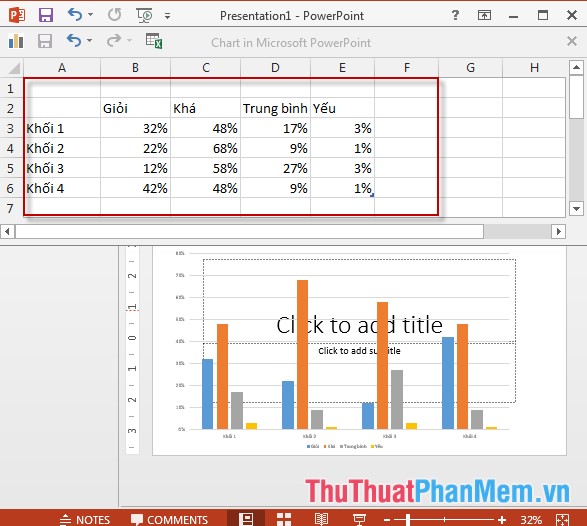
- The graph results have been created:

2. Edit the chart.
2.1 Change the font, there is text on the chart.
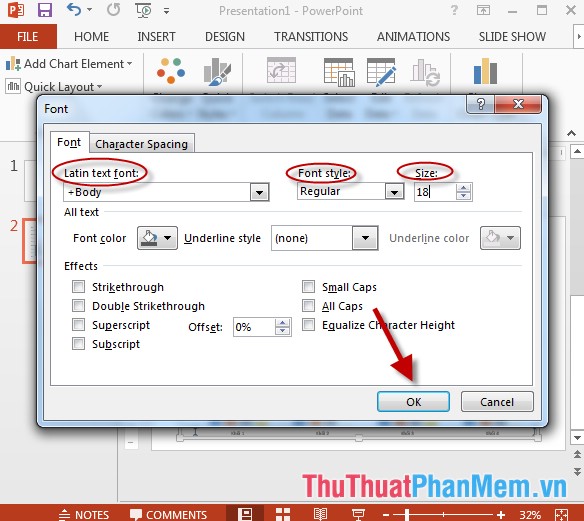
- In case the text on the chart is too small, right-click on any text on the graph-> select Font:

- A dialog box appears -> select the font, font style and font size as required -> click OK:
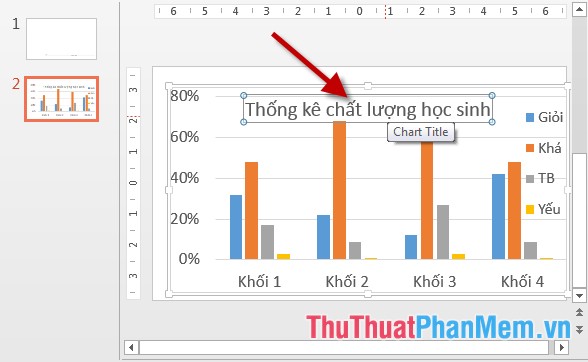
- After making your selection, edit and add content to the title of the chart:
2.2 Add other elements to the chart.
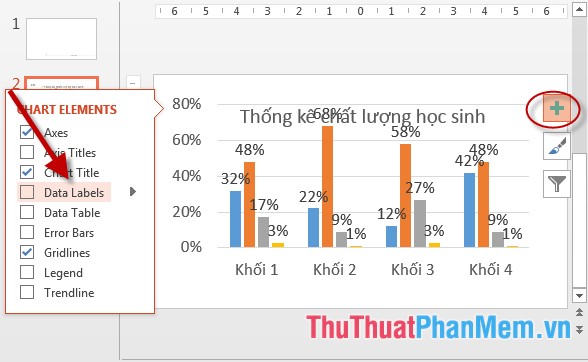
- Click on the Chart Element icon, the list of elements that allows you to add to the chart, for example, adding data on the chart, and clicking Data Labels:
2.3 Edit chart style.
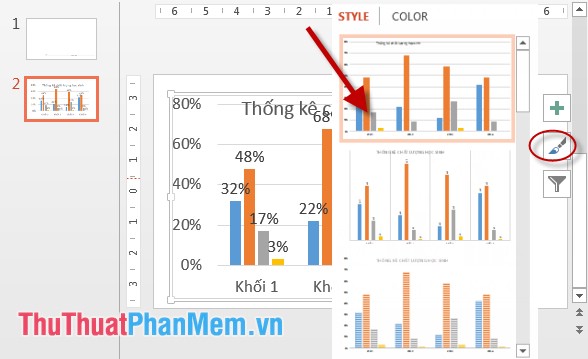
- Click on the Chart Style icon -> list of display chart templates -> select the template you want to change for the chart:
2.4 Filter data on a chart.
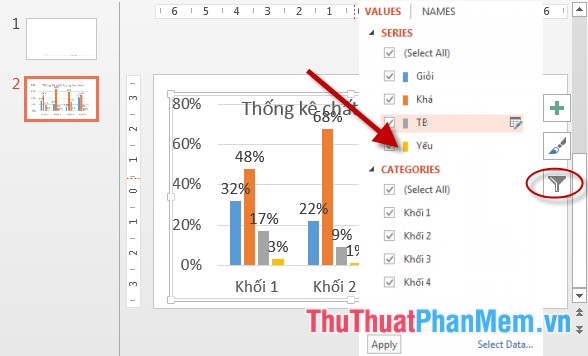
- If you want to filter the data on the chart by a certain criteria, click Chart Fillters -> select the criteria to filter in the list:
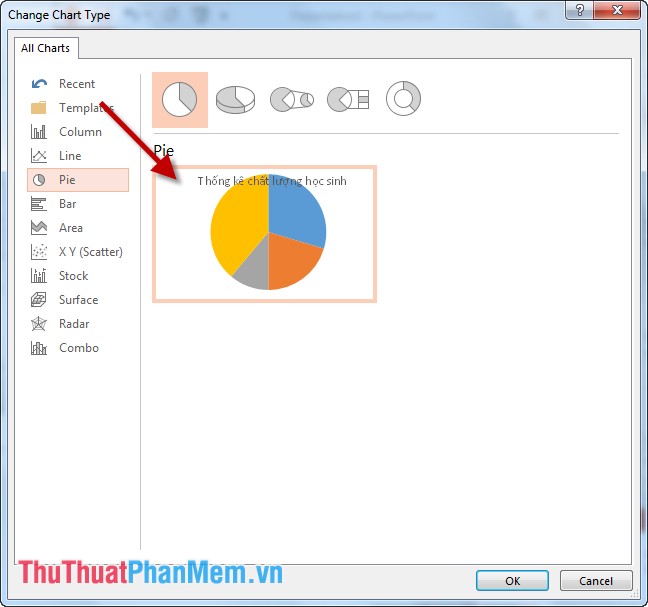
In addition to changing the chart type, click on the chart -> Design -> Change Chart Type:

- The Change Chart Type dialog box appears, select the type of chart you want to change -> click OK:
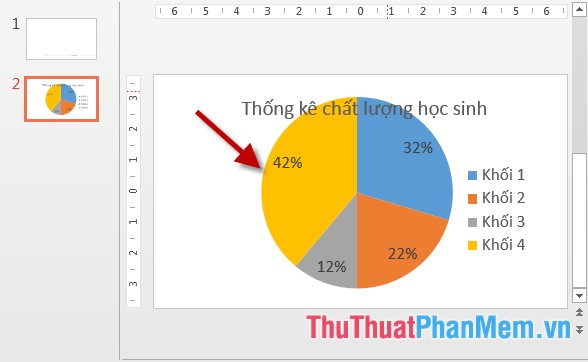
- Results after changing the chart type:
The above is a detailed guide on how to add charts in PowerPoint.
Good luck!
Was this article helpful?
Your feedback helps us improve.
Related Articles
 Basic information about slides in PowerPoint 201611 minutes read
 PowerPoint 2016: Basic information about slides11 minutes read
 PowerPoint 2019 (Part 4): Basic Slide Concepts10 minutes read
 How to convert Google Slides to PowerPoint2 minutes read
 How to delete duplicate slides on PowerPoint is very simple2 minutes read
 How to add and print notes in PowerPoint slides8 minutes read
Reader Comments 0
Sign in with email or Google to join the discussion.