Use Pivot Table in the Google Docs Spreadsheet
TipsMake.com - This week, Google Docs has officially announced the Pivot Tables - Excel's missing feature for a long time. This process is really useful when you have a spreadsheet with huge amounts of data, and you have to create general statistics, with a mechanism that works on rotation, retrieves information from many different angles.
Sample instruction video:
Specifically, we will show more specifically in the steps below. First, you need to prepare a fairly large amount of data, which can be taken from examples on the Internet:

In this example, our number of records is about 10,000
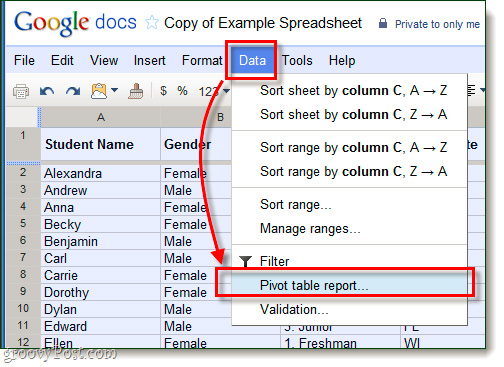
Next, select everything in the spreadsheet (including all rows and columns), then click Data> Pivot Table Report:

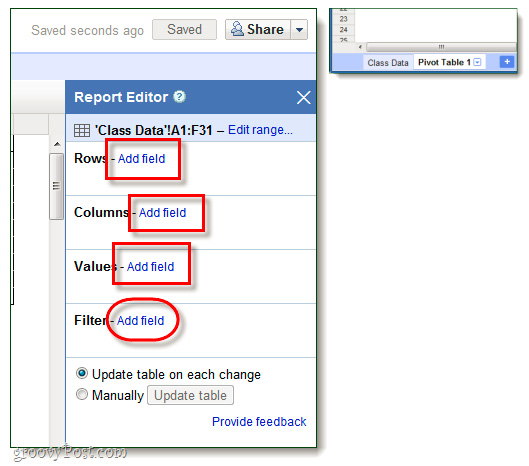
Google Docs will automatically assign a new table (displayed in the lower left corner of the browser) with the name Pivot Table 1 , and notice the new Report Editor tool displayed on the right. This function works like building a general spreadsheet with small scale, users just need to select the corresponding lines and columns, and then the data will be filled in.

Note that you only need to select the necessary pieces of information
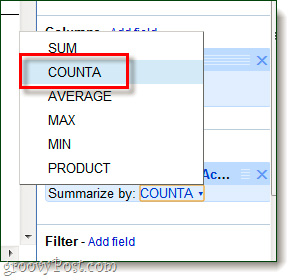
When you assign the Values parameter to the Pivot table, change the settings in the Summarize by section. If you only want to display general statistics, select the COUNTA function:

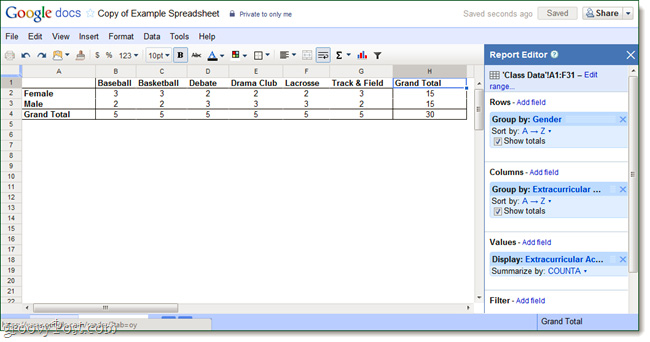
With such basic and effective features, Pivot table is the best tool for handling documents with huge amounts of data. Although this setup process is quite new and simple, it cannot replace Microsoft Excel or Open Office:

Good luck!