Article on the subject of "infographic technology"
-
![[Infographic] Things to know about a hacker](https://tipsmake.com/img/no-image.png)
[Infographic] Things to know about a hacker
have you ever considered a hacker to be a career? the infographic below will help you know if becoming a hacker is right for you.
-
[Infographic] How to become a 'power' user of Google Drive
google drive is a powerful free set of office tools today. quantrimang would like to summarize some valuable features that will help you level up and become a power user of this application.
-
[Infographic] The trend of Chatbot will explode in the future
due to user recognition, more and more bots are combined with advanced artificial intelligence technologies and 80% of businesses are planning to deploy chatbot by 2020.
-
[Infographic] AI and Machine Learning in the enterprise
ai applications are developing very fast and powerful, so businesses that focus on effective use of those applications are becoming a task for every organization.
-
5 Infographics tricks for beginners to Marketing
infographic is not necessarily a 'static' form. electric technology giant (ge) has proved this with great images on their blogs. general electric (ge) introduces their creative ideas to the world with interactive infographic. using these smart images not only helps general electric (ge) 'buy'
-
Want to create a perfect infographic, please refer to this advice from experts
infographic is a combination of information and graphics about a certain field, problem, or advertising campaign. the information in the infographic is explained in an intuitive way through the images. the main purpose of infographic is to 'turn' a complex topic into simple images that help
-
11 free tools that support creating simple infographic
venngage is a great tool for creating and publishing infographic. the reason is quite simple because the tool is very simple and easy to use. you can choose from templates, themes, hundreds of charts and icons as well as upload your own images and wallpapers, or customize a theme to suit your
-
[Infographic] Things to know about a hacker
have you ever considered a hacker to be a career? the infographic below will help you know if becoming a hacker is right for you.
-
[Infographic] Selecting a suitable messaging application for Enterprises
currently there are many famous messaging applications. so how do you choose the most suitable application to develop your business? follow the infographic that quantum has compiled below to troubleshoot your questions.
-
Steps to create an infographic on Canva
infographic is a visual presentation of information in an attractive, easy-to-understand format. a user-friendly design tool like canva lets you transform complex text or numeric information into easy-to-read images.
-
How to create professional Infographic by Piktochart
piktochart is a professional infographic tool, with available infographic styles or you can design your own infographic.
-
[Infographic] The trend of Chatbot will explode in the future
due to user recognition, more and more bots are combined with advanced artificial intelligence technologies and 80% of businesses are planning to deploy chatbot by 2020.
-
12 secrets to designing impressive infographics that captivate viewers.
what are the ideal infographic sizes to make an impression and attract viewers? this article will provide you with the best infographic design tips.
-
[Infographic] What is DevOps? DevOps's impact
devops is a term for activities that are combined from two stages of development and operation, to optimize the software development cycle.
-
[Infographic] AI and Machine Learning in the enterprise
ai applications are developing very fast and powerful, so businesses that focus on effective use of those applications are becoming a task for every organization.
-
[Infographic] Benefits and hazards from Artificial Intelligence
recently, ai or artificial intelligence is frequently mentioned as a breakthrough of the new era. join quantrimang to learn more about the dark side of artificial intelligence compared to the good in the infographic below.
-
[Infographic] Time to narrow the gender gap in Technology
according to a recent study by pwc in the uk, gender gaps in technology start from sitting in school seats and continue to exist through the next stages of girls' lives.
-
Top 10 websites to create beautiful infographics
with the help of the following online infographic design tools, creating infographics will be extremely simple and fun.
-
How to create the most beautiful and creative infographic
how to create the most beautiful and creative infographic. creating infographic products requires users to have knowledge of many different fields such as design, presentation, ... but for the basic users who want to create beautiful infographics, you just need to pay attention to some key content
-
[Infographic] VAR Survey: The controversial technology on the pitch
var is the abbreviation for video arbitration support technology (video assistant referee). this technology is used to help football referees can make the best decisions possible on the pitch.
-
12 secrets of creating Infographic 'capturing' viewers
when users are increasingly lazy to read, using infographic is a very effective way to market content. however, optimizing the benefits of this tool also requires you to understand certain tricks.
-
[Infographic] How to become a 'power' user of Google Drive
google drive is a powerful free set of office tools today. quantrimang would like to summarize some valuable features that will help you level up and become a power user of this application.
-
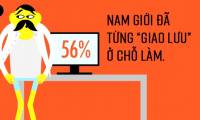
'That story' and 15 facts surprise you
what did you know and didn't know about 'that', see the infographic below to better understand the topic everyone knows, but no one dares to say it!
-
8 things to note when doing Infographic
infographic is a powerful solution for connecting information because it helps data sets and visual images - the left brain and right brain - thus making it easier for users to comprehend and memorize and share more information.
![[Infographic] Things to know about a hacker](https://tipsmake.com/data/thumbs_200x120/[infographic]-things-to-know-about-a-hacker_thumbs_200x120_vo5AnvfJV.jpg)
![[Infographic] How to become a 'power' user of Google Drive](https://tipsmake.com/data/thumbs_200x120/[infographic]-how-to-become-a-power-user-of-google-drive_thumbs_200x120_bhOH17wjk.jpg)
![[Infographic] The trend of Chatbot will explode in the future](https://tipsmake.com/data/thumbs_200x120/[infographic]-the-trend-of-chatbot-will-explode-in-the-future_thumbs_200x120_jVjN3laLO.jpg)
![[Infographic] AI and Machine Learning in the enterprise](https://tipsmake.com/data/thumbs_200x120/[infographic]-ai-and-machine-learning-in-the-enterprise_thumbs_200x120_w2E13vCVn.jpg)


![[Infographic] Selecting a suitable messaging application for Enterprises](https://tipsmake.com/data/thumbs_200x120/[infographic]-selecting-a-suitable-messaging-application-for-enterprises_thumbs_200x120_teY9FSCJb.jpg)


![[Infographic] What is DevOps? DevOps's impact](https://tipsmake.com/data/thumbs_200x120/[infographic]-what-is-devops-devopss-impact_thumbs_200x120_1FuiJIyOh.jpg)
![[Infographic] Benefits and hazards from Artificial Intelligence](https://tipsmake.com/data/thumbs_200x120/[infographic]-benefits-and-hazards-from-artificial-intelligence_thumbs_200x120_yWqFPioEh.jpg)
![[Infographic] Time to narrow the gender gap in Technology](https://tipsmake.com/data/thumbs_200x120/[infographic]-time-to-narrow-the-gender-gap-in-technology_thumbs_200x120_mRYCuUCwo.jpg)

![[Infographic] VAR Survey: The controversial technology on the pitch](https://tipsmake.com/data/thumbs_200x120/[infographic]-var-survey-the-controversial-technology-on-the-pitch_thumbs_200x120_l3Iw2Y73u.jpg)