Table of Contents
This guide provides a practical overview of Steps to Make Presentation Reports by Powerpoint Fast and Beautiful for, including its main features, benefits, limitations, and important considerations.
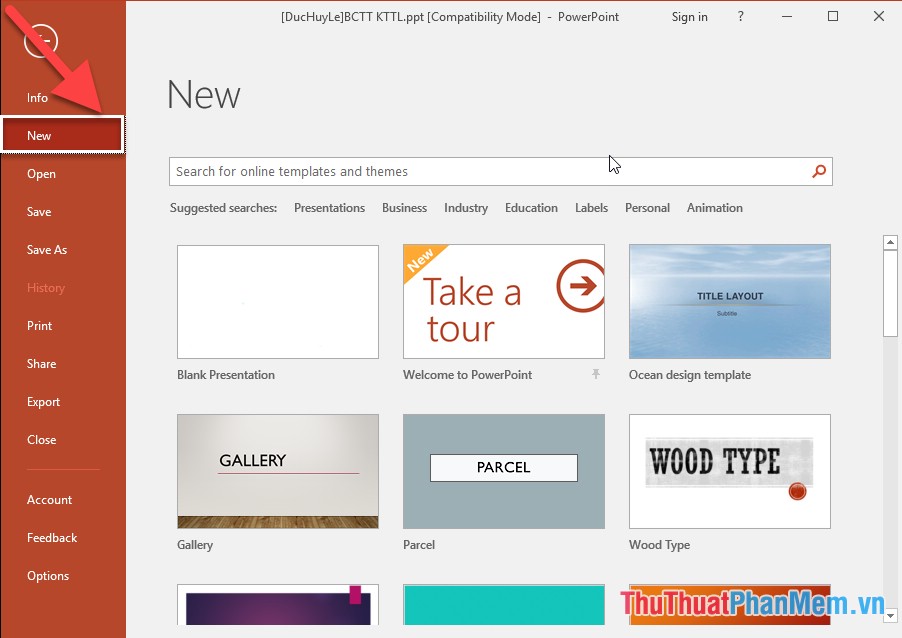
Step 1: Start PowerPoint -> go to File -> New there are template templates for you to choose:
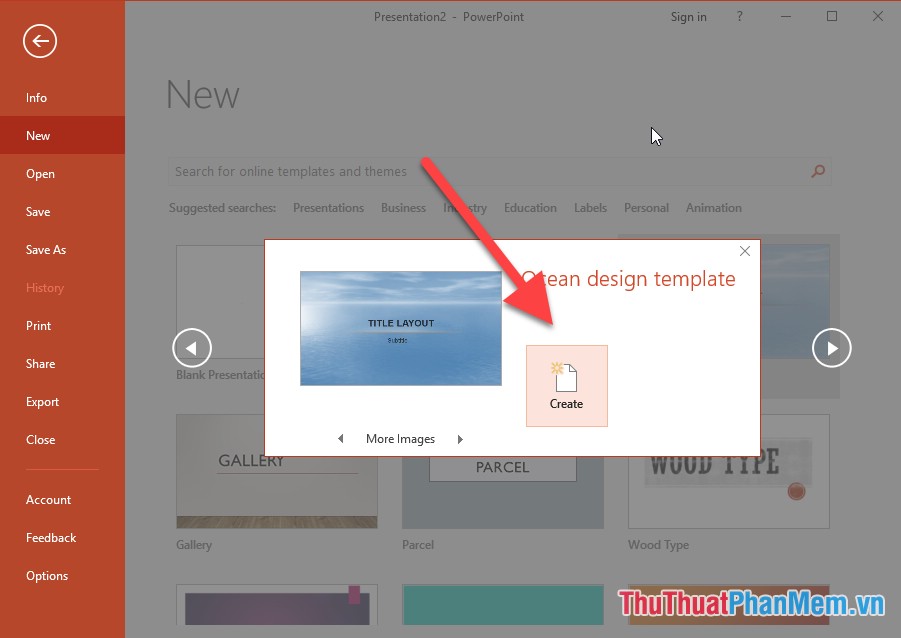
Step 2: Click on your favorite pattern -> Creat:
Step 3: Enter a general title and introduction for the report you want to create:
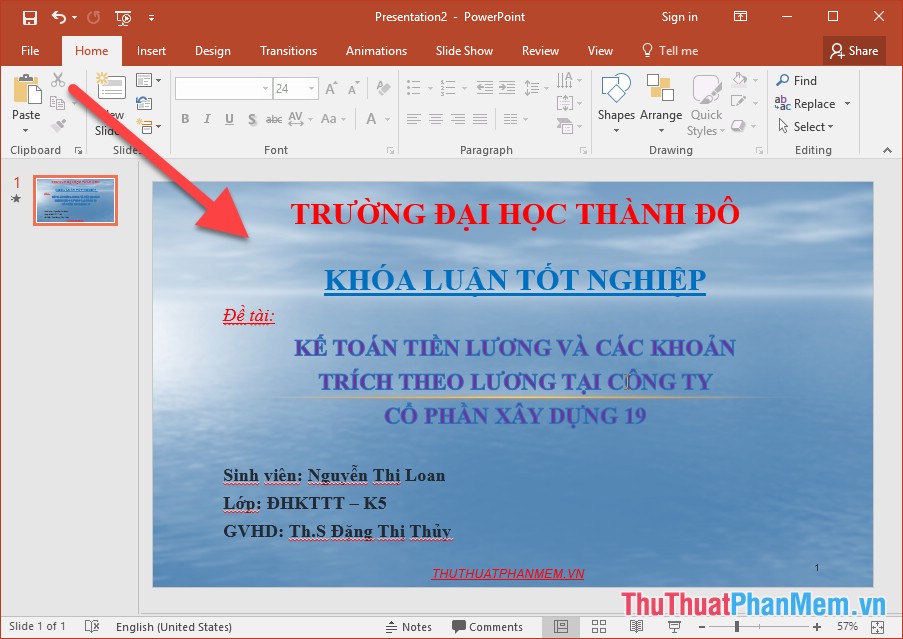
- During designing to create an impressive beautiful Slide without distracting the viewers, you need to pay attention to choose a dark background with bright text or vice versa to ensure maximum contrast to help you emphasize the content to be presented. Absolutely shaded effect should be avoided.
Step 4: After creating the introductory silde, you need to create the Slide master you only need to format the font, font size and font color for all slides to create next. Click View -> Slide Master:

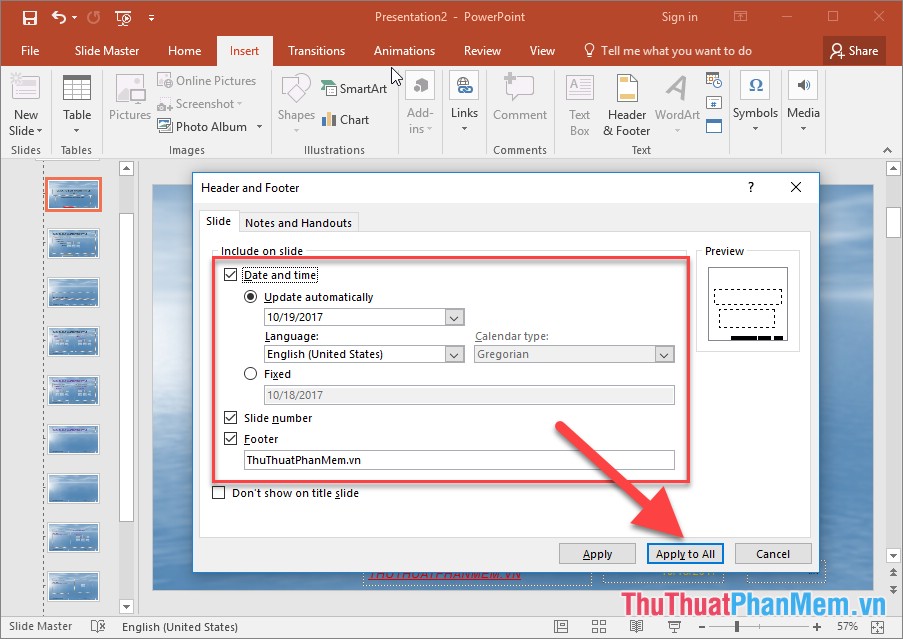
Step 5: Implement font format, size and color for the text. You need to pay attention not to use too many fonts in a slide, using traditional fonts should not use fonts sir. For font sizes larger than 36 points, the rest of the font size is larger than 24 points. In addition, you can create a header, footer, page number for Slide by clicking Insert -> Header and footer:

Step 6: Enter content as your request. For example, here insert the page number, enter content Footer -> finally click Apply to all:
- Each Slide should not enter too many words, only enter 5-7 lines on a slide.
Step 7: After formatting the Slide master, click Close Master View close:
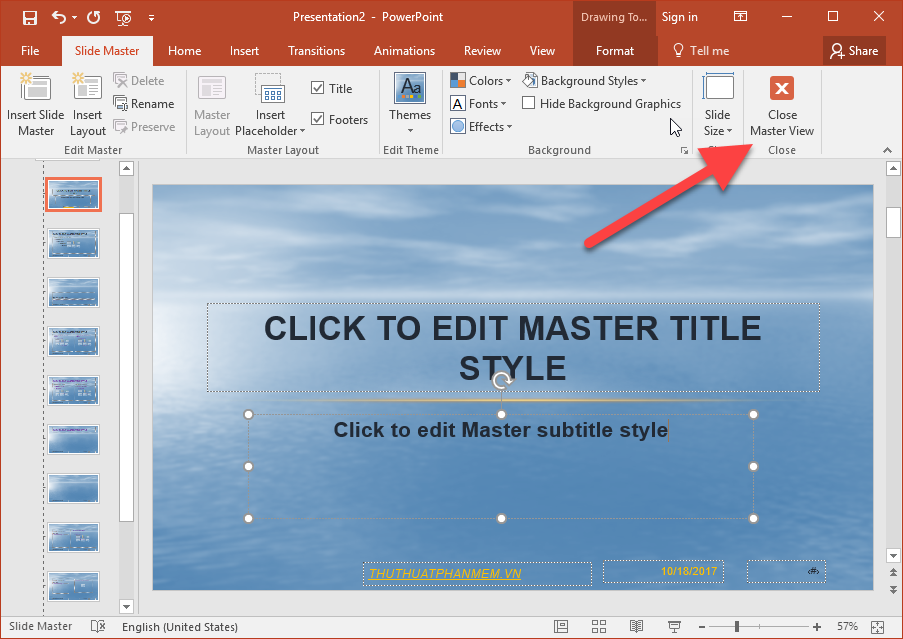
Step 8: After creating the Silde Master right click on the left pane select New Silde to create the next content:
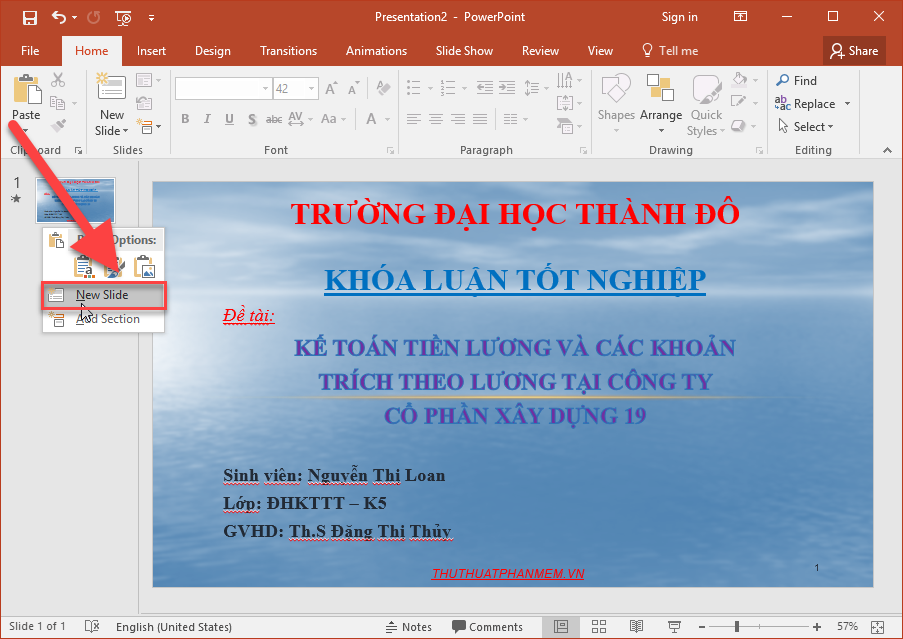
Step 9: Enter the content for Slide with the format set in the Silde master:
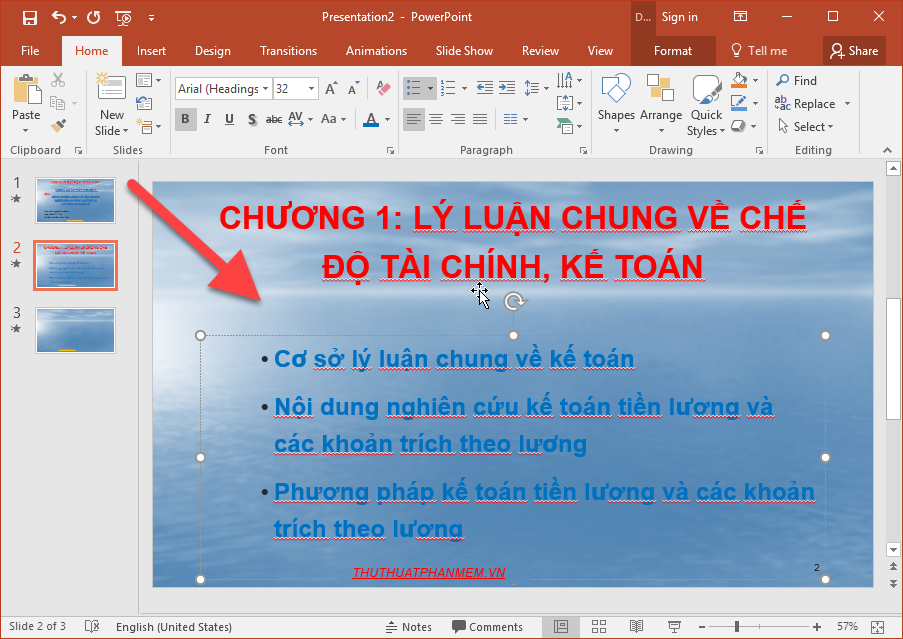
- In case the next Silde has the same layout as the slide just created, copy this silde for the next slide:
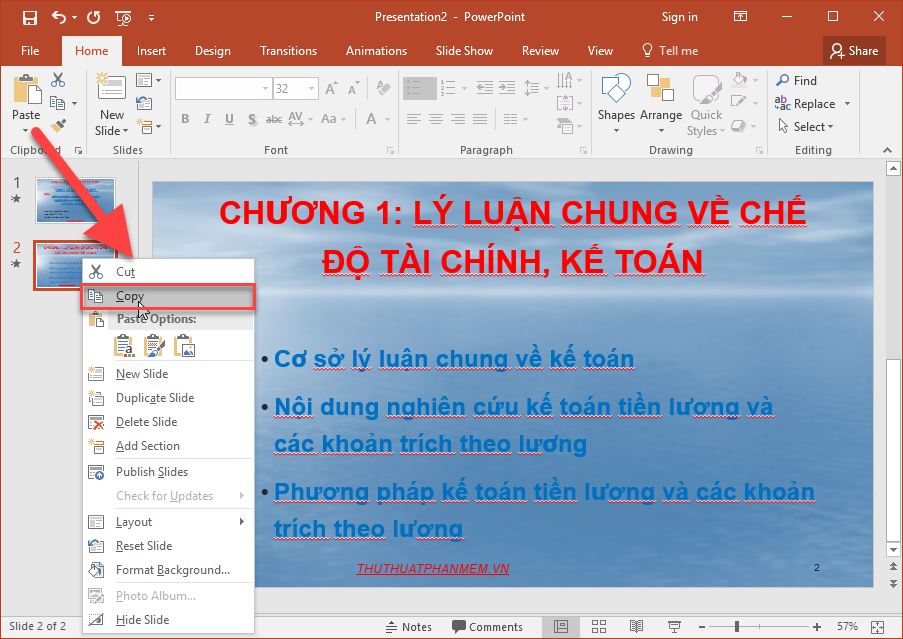
- You just need to edit the content for the next slide:
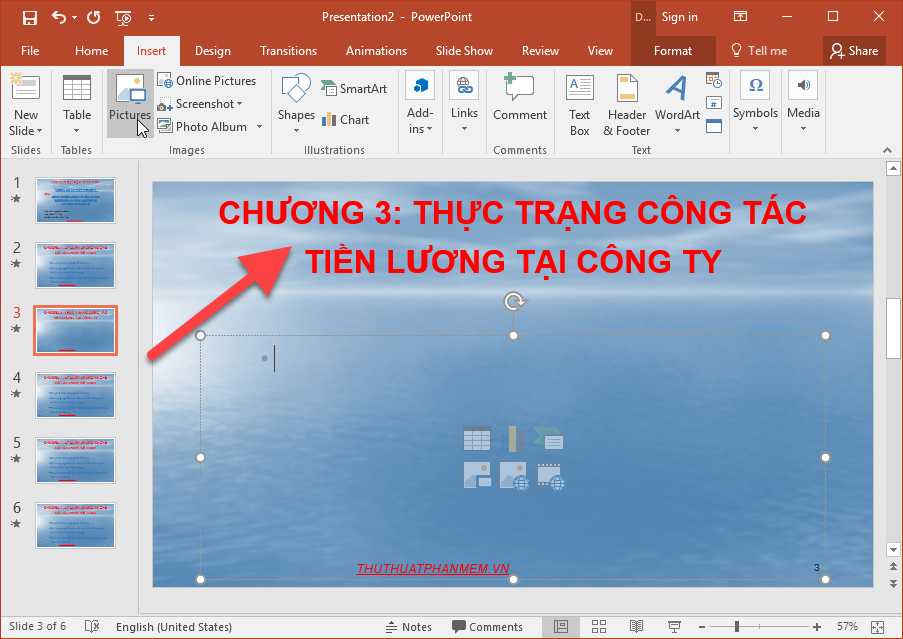
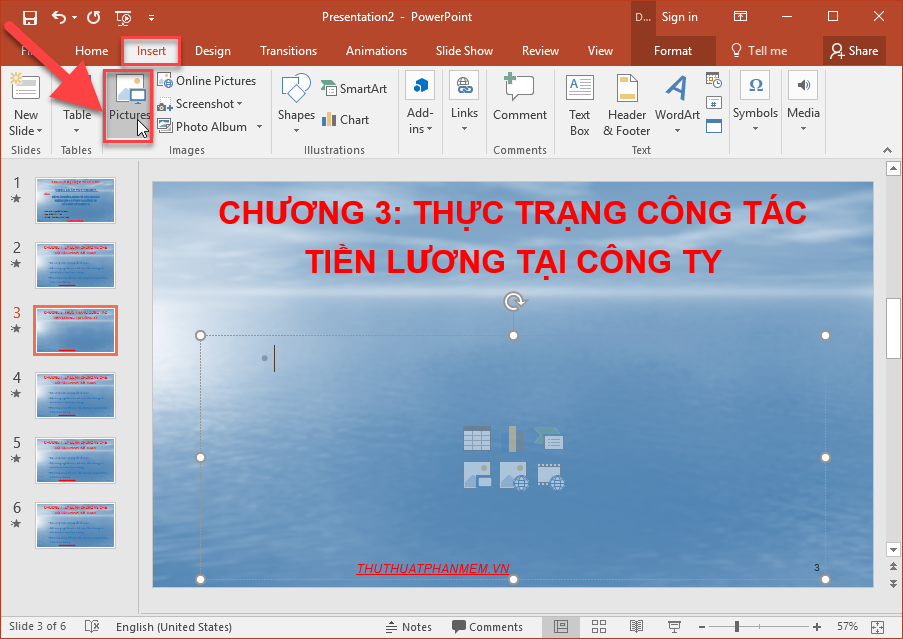
Step 10: During creating slides, need images to illustrate, click Insert -> Pictures:
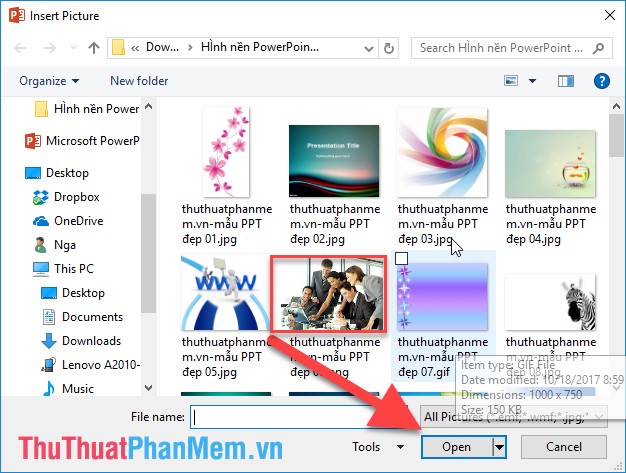
Step 11: The Insert Picture dialog box appears, select the image to be inserted -> Open:
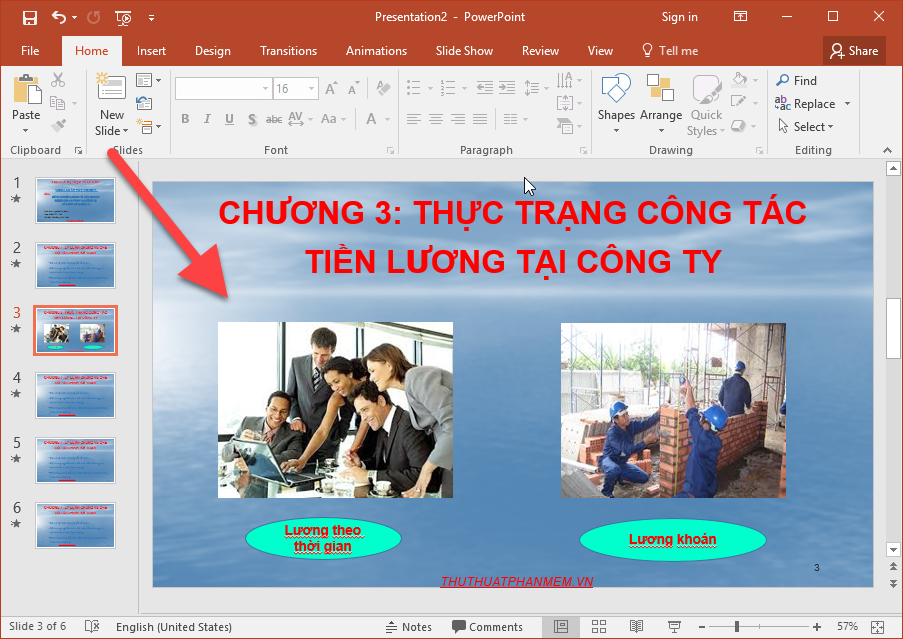
- Results of inserting images into slides:
Step 12: You want to draw a diagram illustrating the organization chart of the company, click Insert -> Shapes to select the image you want to draw:
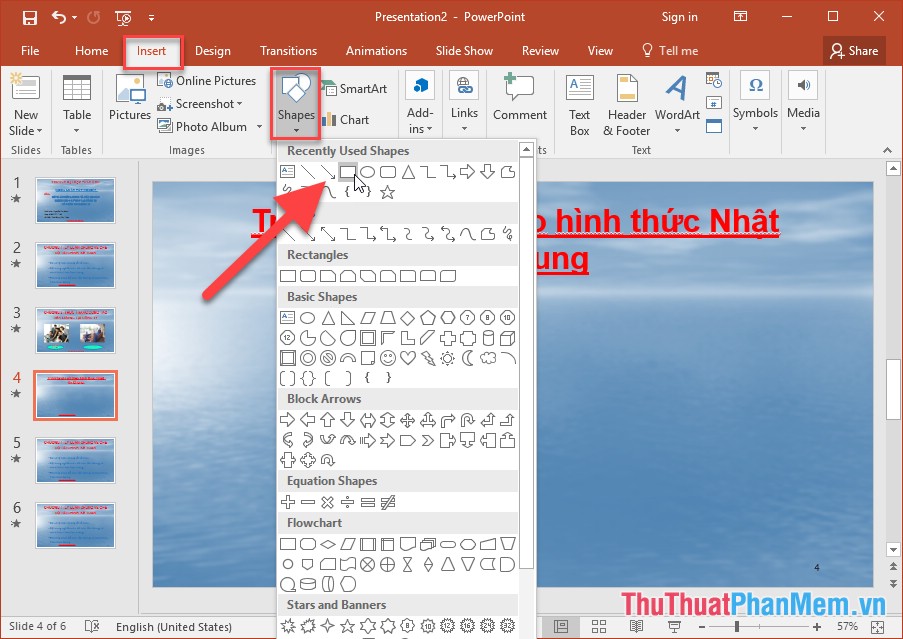
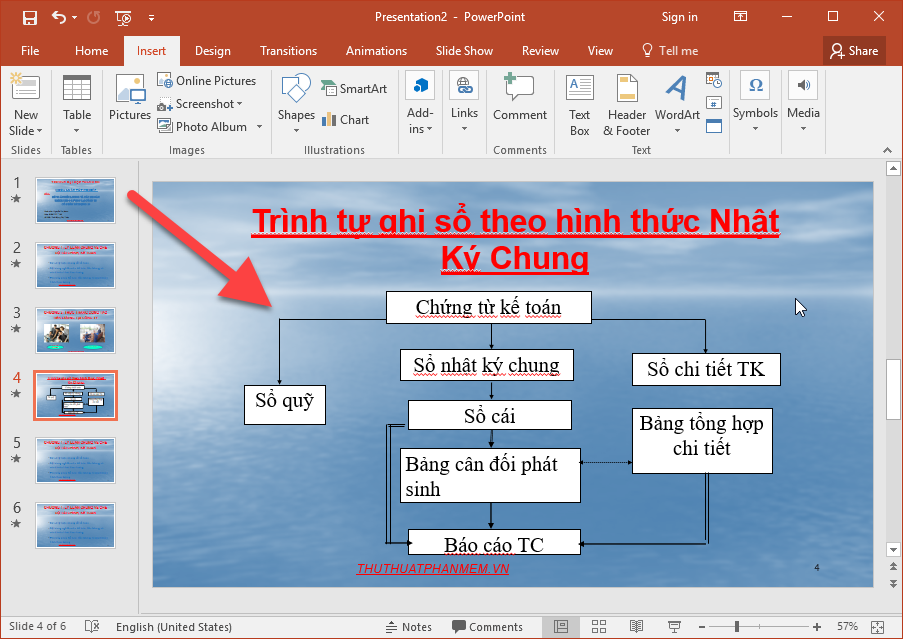
- Select the image you want to draw, for example here create a flow chart:
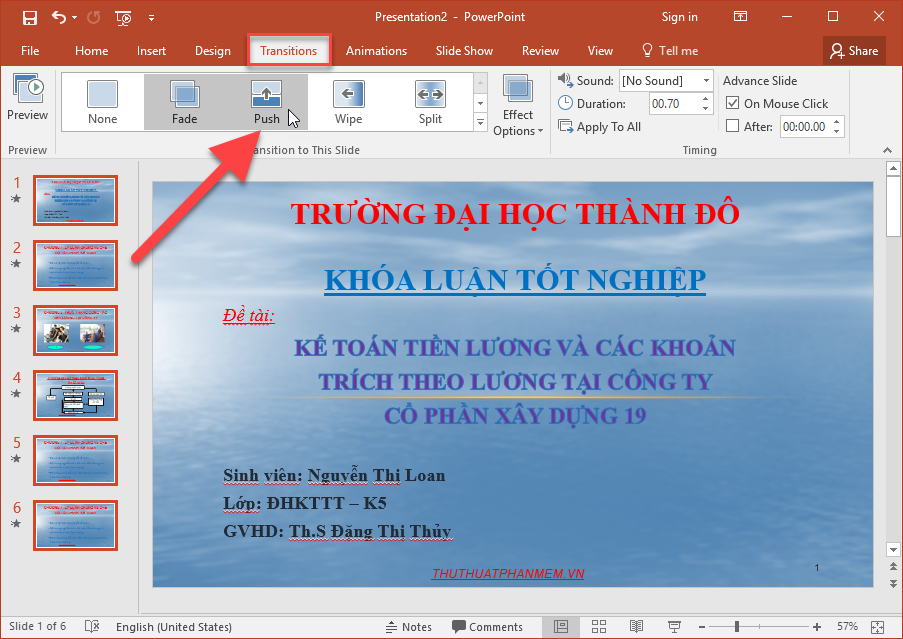
Step 13: After creating the content for all slides you create effects for the Slide. Click Transitions to create transition effects for Slide (To create the same effect for all slides press Ctrl + A to select the entire slide before clicking Transitions) -> choose the appropriate effect with the slide content you want to create:
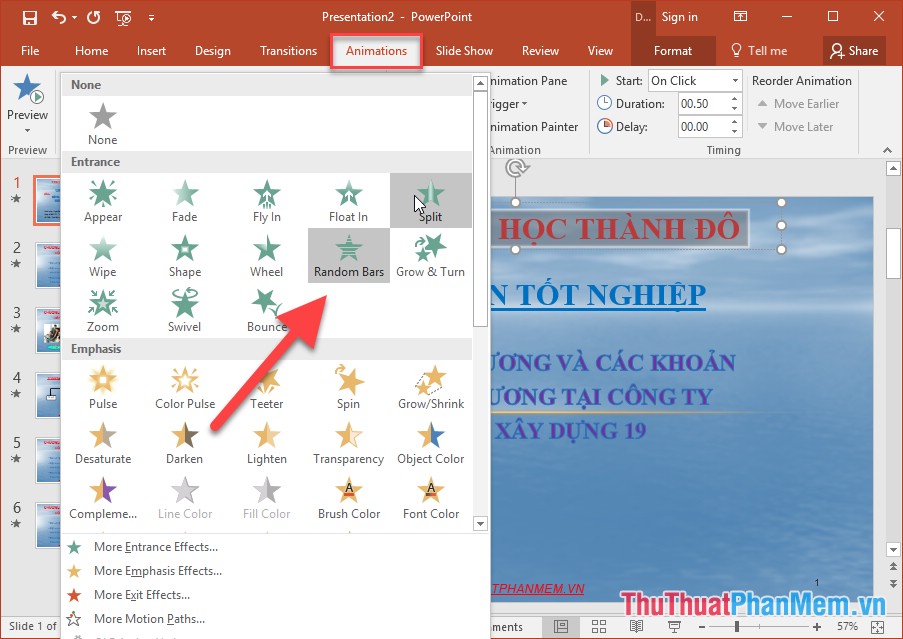
Step 14: Select effects for each object on the slide by clicking the object you want to create -> Animations -> select the effect you want to create:
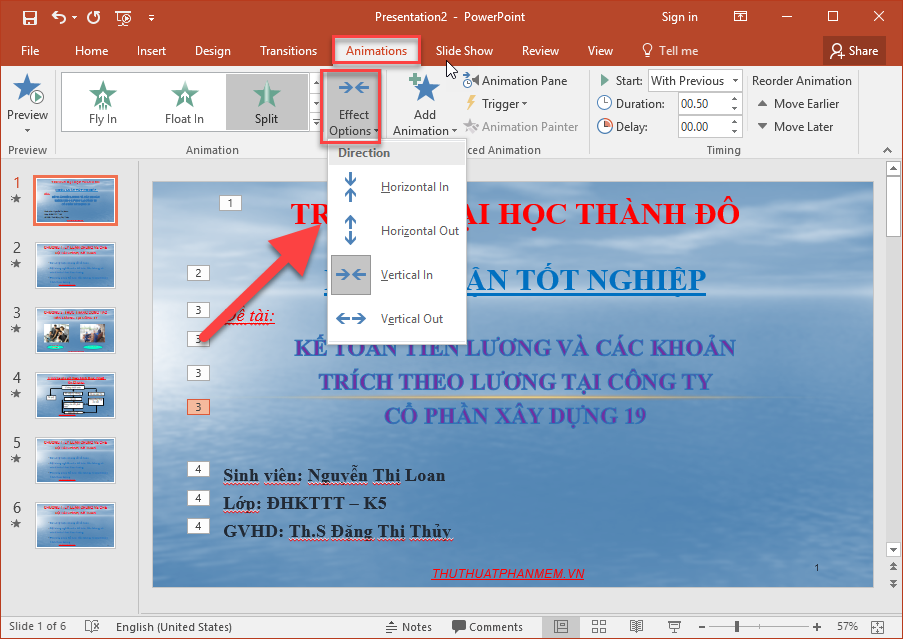
Step 15: After selecting the effect for the slide if you want to change the position of the effect, click Effects Options and choose to move the effect to horizontal or up or down:
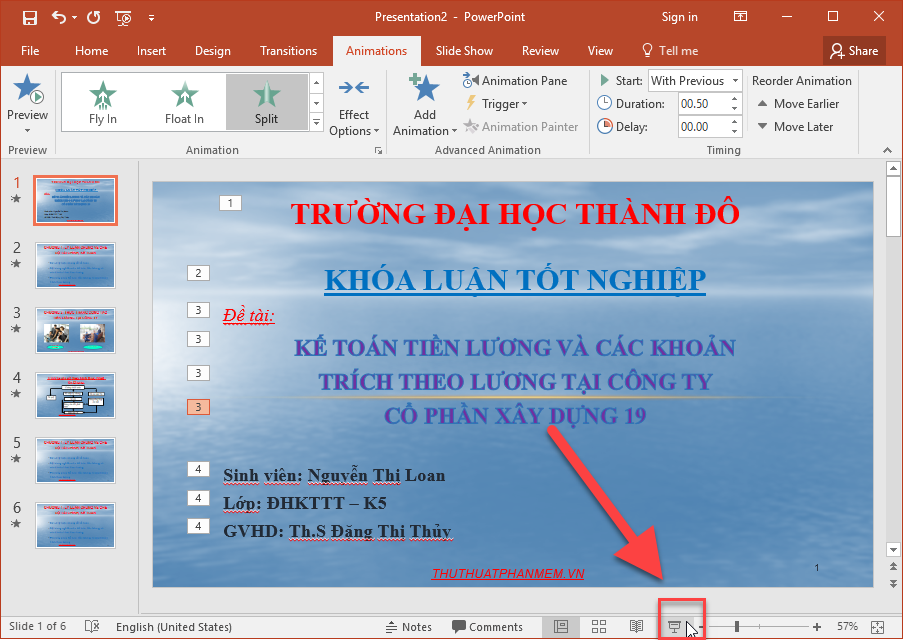
- Finally, click the Slide Show icon to preview the newly created Slide (or press Shift + F5):
- Use the left mouse button to switch pages and move objects:

- During the test run, if you find it inappropriate, you can change the content and effects so that the report reaches the best results:

Above is a detailed guide of Steps to make presentation reports by Power fast and beautiful. Good luck!
FAQ
What should I know about Steps to Make Presentation Reports by Powerpoint Fast and Beautiful for?
Focus on the key features, requirements, limitations, and practical use cases explained in this guide.
How do I get the best results with Steps to Make Presentation Reports by Powerpoint Fast and Beautiful for?
Follow the recommended steps, use current software or information, confirm compatibility, and review settings before major changes.
Are there any risks or limitations?
Potential limitations depend on compatibility, data quality, cost, privacy, support, and how the product or method is used.
Related Articles
 How to Make PowerPoint Presentation Slides Nice and Fast10 minutes read
 Beautiful PowerPoint Backgrounds, Professional PowerPoint Backgrounds3 minutes read
 How to Make Beautiful and Simple PowerPoint for Beginners5 minutes read
 Create Beautiful Slides for PowerPoint Presentations with 8 Tips6 minutes read
 How to Make Crosswords on PowerPoint Fast and Beautiful10 minutes read
 The Most Beautiful Green Powerpoint Wallpapers3 minutes read
Reader Comments 0
Sign in with email or Google to join the discussion.