Table of Contents
This guide provides a practical overview of Instructions on How to Extract Data, including its main features, benefits, limitations, and important considerations.
1. Simple extracting data
For example, a table of data to extract students with the same score:
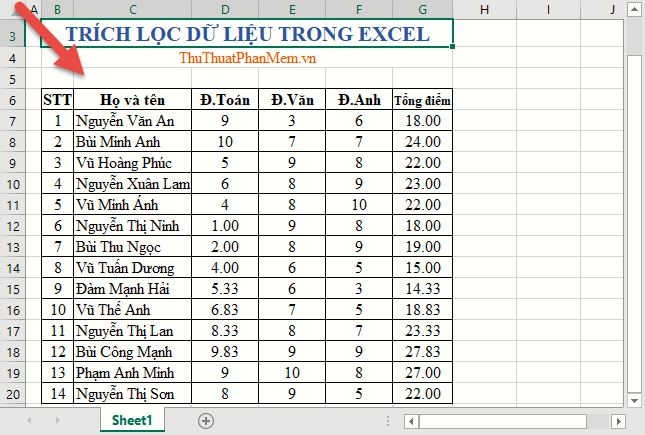
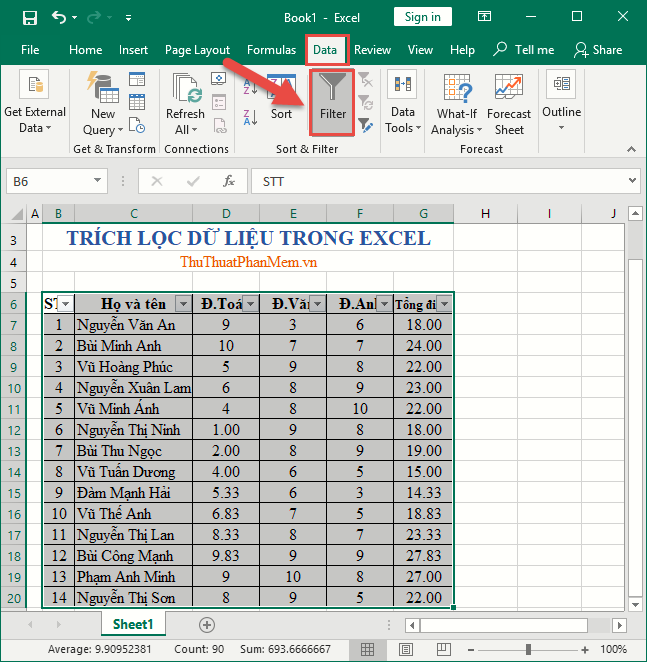
You only need to highlight the data area to be extracted -> into Data -> Fillter:
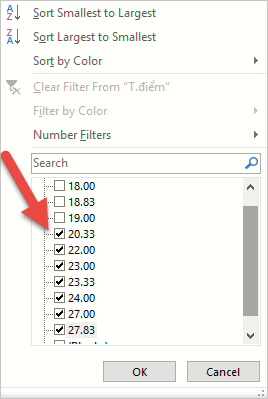
An arrow appears in the header row to help you extract the data. For example, if you want to extract students who have a total score of 22. Select the arrow in the Points column -> check the Select All check box -> select the 22 value -> click OK:
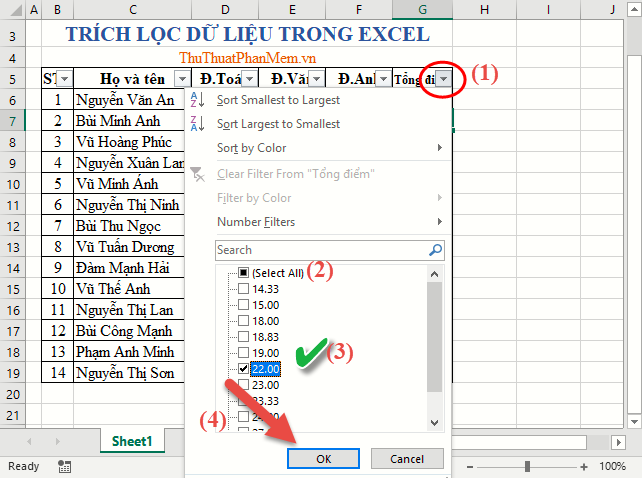
The result you have extracted students with the same score of 22.

If you want to extract multiple values, for example, extract students with a total score of 20.33 to 27.83, you just need to select the prices from 20.33 to 27.83. However, this method will not be accurate if the list of students is large.
2. Conditional extracting
2.1 Extract filter with 1 data field containing 1 condition
For large amounts of data you should use this method to extract data.
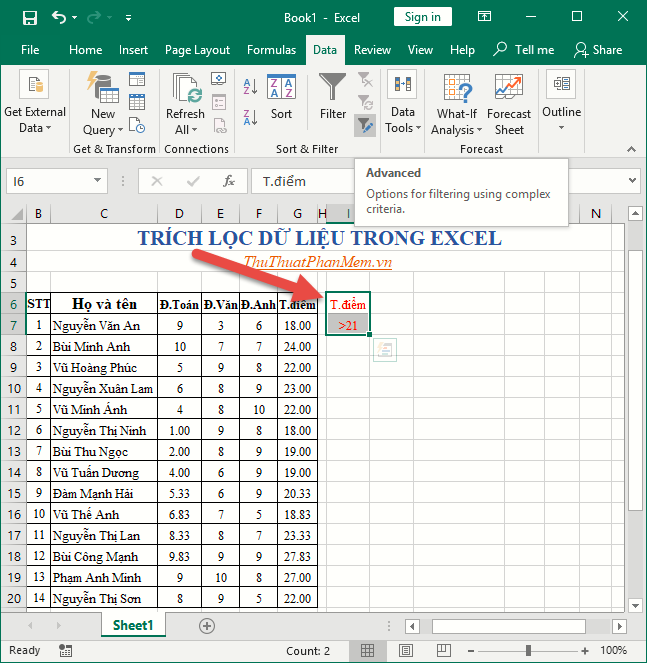
For example, if you want to extract students who pass the exam with an overall score greater than 21, the filter list is set to another wallet to facilitate the printing process.
Step 1: Make conditions with the column headings and condition values, note here the title name must match the title in the table to extract data:
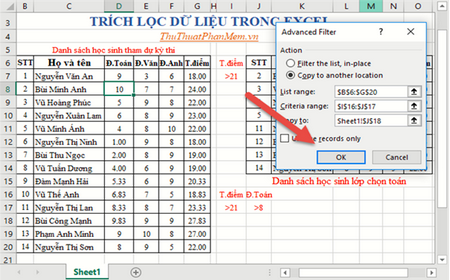
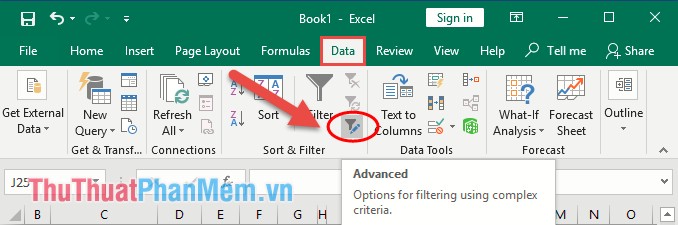
Step 2: Go to Data tab -> Advanced:
Step 3: Advanced dialog box appears as follows:
- Tick to Copy to another location : to select the extracted content to a new location.
- List List range: Click the arrow to select the data area containing the data to extract.
- Section Cirteria range: Select conditions for extracting data
- Item Copy to: Select the location to paste the content of the data after it has been extracted.
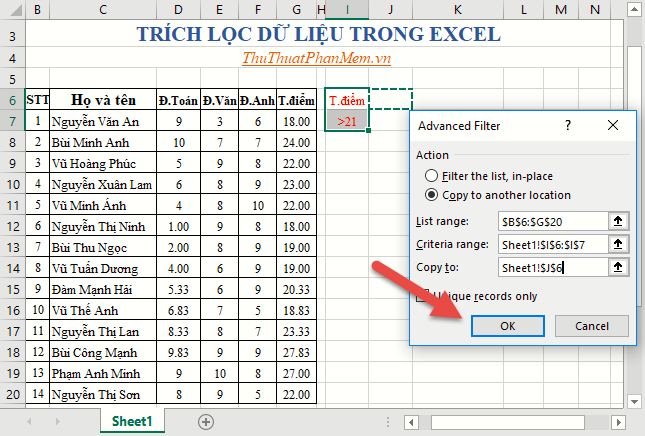
Step 4: Finally, click OK -> the data has been extracted to the new location you have selected:

2.2 Extract data with many conditions
For filtering data that contains many conditions, you need to pay attention, the conditions on the same row and the column header name containing the extraction condition must match the column header name in the source data table.
For example, need to extract students with a total score greater than 21 and a math score greater than 8 to classify in the class you choose to create conditional columns as shown:
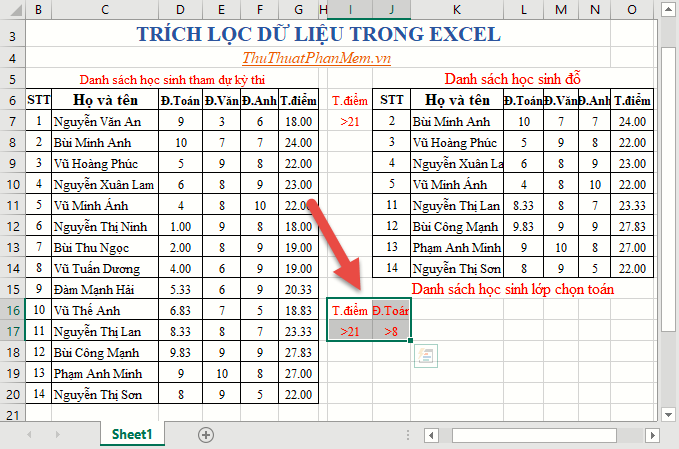
Similar to filtering data with a condition, with many conditions in Cirteria range, you select all created conditions:

As a result, you have extracted data with 2 conditions, easily arranging students into maths selection class:

Similarly, if you want to put students in a class to choose literature, choose him.
Above is a detailed guide to help you extract data simply and easily from which to save working time.
Good luck!
Frequently Asked Questions
What should I know about Instructions on How to Extract Data?
Focus on the key features, requirements, limitations, and practical use cases explained in this guide.
How do I get the best results with Instructions on How to Extract Data?
Follow the recommended steps, use current software or information, confirm compatibility, and review settings before major changes.
Are there any risks or limitations?
Potential limitations depend on compatibility, data quality, cost, privacy, support, and how the product or method is used.
Was this article helpful?
Your feedback helps us improve.
Related Articles
 How to Use Data Miner to Extract Data from Websites12 minutes read
 How to Extract Numbers or Text from Excel6 minutes read
 How to Import Data from Photos into Excel3 minutes read
 Extract Excel Content Into Image Format2 minutes read
 What Is the Function in Excel That Extracts a String of Characters?5 minutes read
 Unzip Zip, RAR,. Files Online Without Software: Extract Files7 minutes read
Reader Comments 0
Sign in with email or Google to join the discussion.