The following article will guide you in detail how to filter advanced data in Excel.

Data Filter (automatic data filtering) allows you to filter data only on a single column or data field -> so it is limited when using data. Excel supports the Advanced Filter feature that allows you to filter data on multiple columns.
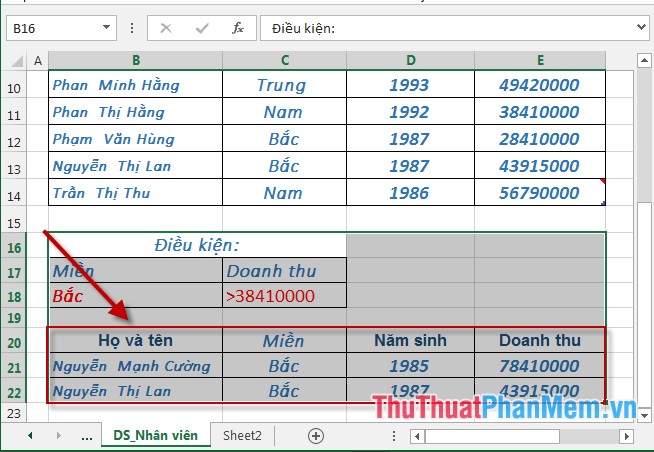
For example, if you want to filter data from Northern employees with sales greater than 3841000:
Step 1: Create a condition area outside the data table to filter -> Data -> Advanced:

Step 2: The Advanced Filter dialog box appears:
- List Range: Select the data area to filter:
- Criteria range: Select the container containing the conditions to filter.
- Filter the list, in place: Filter right on the original data area.
- Check the Copy to another location option if you want the filter results to show other data areas -> select the location to filter data in the Copy to -> section and finally click OK:

Step 3: After clicking OK, the result is:
- In case you want to filter many conditions on different fields, you just need to re-enter the condition area data and select the condition area again in the Advanced Filter dialog box -> OK:

- After clicking OK the results:

Above is a detailed guide on advanced data filtering in Excel 2013.
Good luck!


 The quickest way to filter data by color in Google Sheets.
 Excel 2019 (Part 19): Filtering Data
 Sort and filter data
 3 Functions to Help You Stop Wasting Time in Excel
 Filters You Should Clean and Replace in Your Home
 Why use sender domain filtering rules in email?