How to use SysGauge to monitor 'health' Windows computers
SysGauge is a free software that monitors Windows computer health, checks CPU usage, network transfer speed, operating system performance, etc.
Regular monitoring of the health of components in Windows computers, as well as the parameters of the components in the PC will help users to understand the status of the machine, preventing unnecessary risks to the system. Therefore, software that monitors and displays information about each part of the PC is always provided to users, along with useful upgrades.
In the following article, we will introduce you to Windows computer monitoring software called SysGauge. This tool is capable of monitoring CPU, memory, network transfer speed, operating system performance, read and write speed, etc. So using SysGauge computer monitoring software like that what?
- Summary of tips to fix computer errors Windows 10/8 / 8.1 / 7 and Windows XP running slowly
Step 1:
Click on the link below to download the software to your computer. SysGauge is provided completely free of charge.
- http://www.sysgauge.com/downloads.html
Step 2:
Next click on the .exe file to install the SysGauge software on the computer. In the first interface click Next .

Step 3:
Switch to the new interface, we click Next I Agree to agree to the installation terms and use SysGauge.

Step 4:
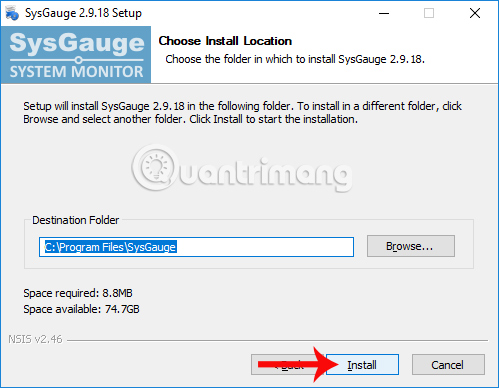
Switch to the new installation interface, click Browse to change the SysGauge installation directory if you want. Then click the Install button below to proceed to install SysGauge.
Step 5:
When the installation process finishes click Next .
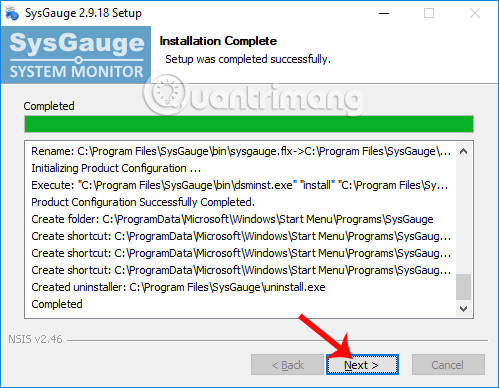
Finally click Finish to close the SysGauge installation window and launch the software on the computer.

Step 6:
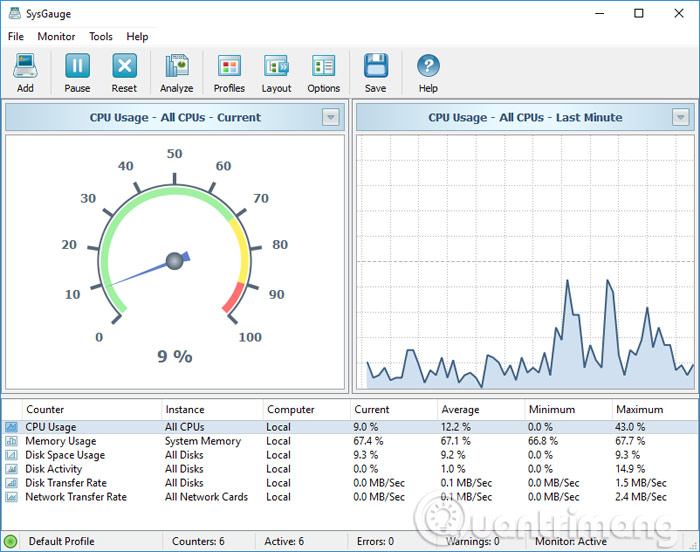
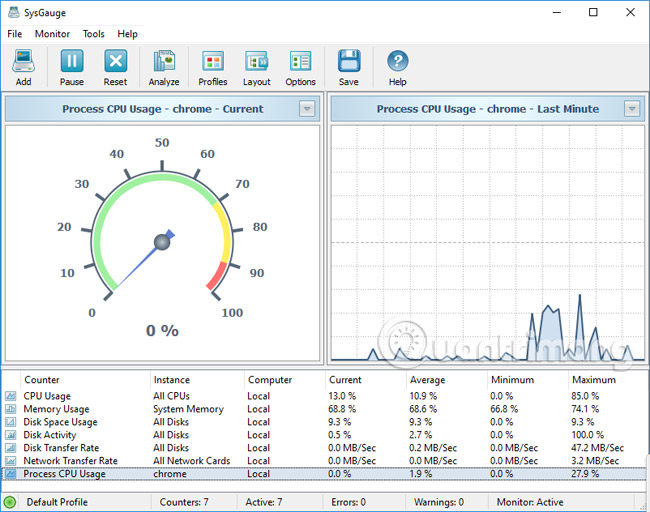
SysGauge's main interface is relatively simple. The real-time CPU operation status is displayed through 2 types of charts: digital clock chart and line chart. Below will be detailed information about network parameters, hard drive, RAM, GPU, .
Step 7:
If the user wants to add the option to monitor the status of certain hardware in the main interface, click the Add button in the menu bar.

Appears the Add Counter panel interface with the system monitoring options. In this dialog box you can see, SysGauge provides hardware monitoring options, monitoring system status when launching one or more software on the machine. From there, users can know how the software affects the system.
In the Process Status section, select the software you want to evaluate and then click the Add button . For example, here I will add Chrome browser to the monitoring section on SysGauge.
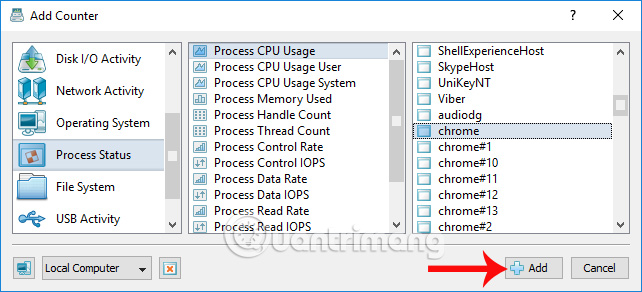
You will then see SysGauge monitor Chrome browser activity on the system.
Step 8:
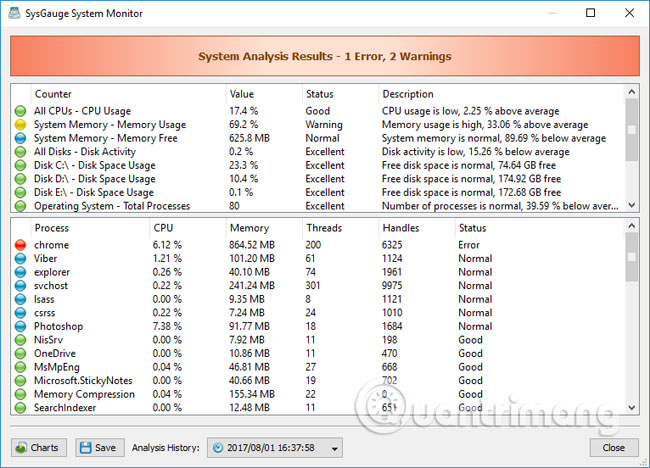
Next click on Analyze to get a general report on the health status of tracking components on the system. We wait a few seconds for the software to summarize.

You will then receive the overall status of the tracking component.
Step 9:
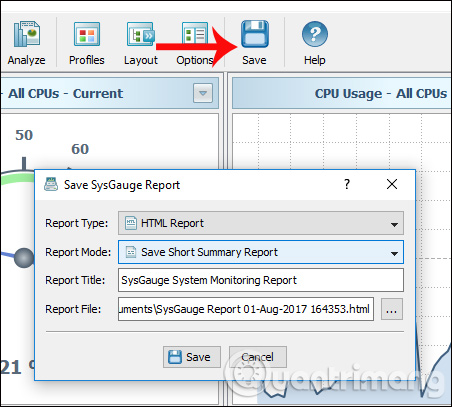
If the user wants to save SysGauge system tracking information into a PDF or Word file, click the Save button above.
So we know the health and operation status of components on Windows computers. SysGauge will tell you if your computer has any problems, monitor the system even when using certain software or applications. In addition, creating a track to a Word or PDF file also helps you in the case of a technician's advice.
I wish you all success!
- How to Control the Brightness of Your Computer With Windows 7
- 5 ways to open Resource Monitor in Windows 10
- 11 ways to start the Performance Monitor performance monitor in Windows
- How to Connect Two Monitors
- Buy a good brand of home electronics health?
- 6 best tools for analyzing laptop battery health


