How to monitor GPU performance in Task Manager of Windows 10
Task Manager of Windows 10 has hidden GPU monitoring tools. You can view GPU usage on each application and the entire system. And Microsoft promises the number that Task Manager provides will be more accurate than third-party performance monitoring utilities.
Task Manager of Windows 10 has hidden GPU monitoring tools. You can view GPU usage on each application and the entire system. And Microsoft promises the number that Task Manager provides will be more accurate than third-party performance monitoring utilities.
How this feature works
These GPU features were added in the Fall Creators Update Update of Windows 10, also known as Windows 10 version 1709. If you are using Windows 7, 8 or an earlier version of Windows 10, you will not see These tools are in Task Manager. Here's how to check the version of Windows you're using.

Windows uses newer features in Windows Display Driver Model to pull this information directly from the GPU scheduler (allocate applications handled by priority) (VidSCH) and video memory manager (VidMm ) in WDDM's graphics core, responsible for real resource allocation. It displays very accurate data of any API application used to access GPUs such as Microsoft DirectX, OpenGL, Vulkan, OpenCL, NVIDIA CUDA, AMD Mantle or any other application.
That's why only systems with WDDM 2.0-compatible GPUs display this information in Task Manager. If you don't see it, it means that the system GPU uses older drivers.
You can check the WDDM version that the GPU driver uses by pressing Windows + R , type ' dxdiag ' in the search box and then press Enter to open the DirectX Diagnostic tool. Click on the " Display " tab and look to the right of " Driver Model " in Drivers. If you see the ' WDDM 2.x ' driver here, it means your system is compatible and if you see the ' WDDM 1.x ' driver means your GPU is not compatible.
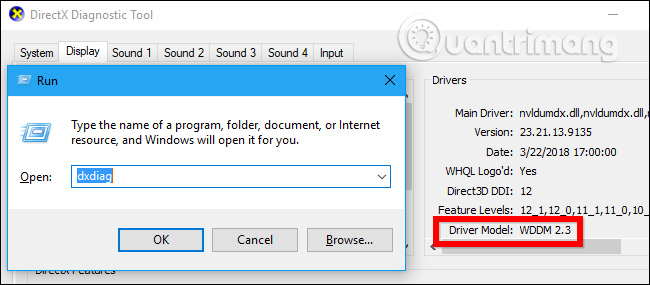
How to view GPU usage of the application
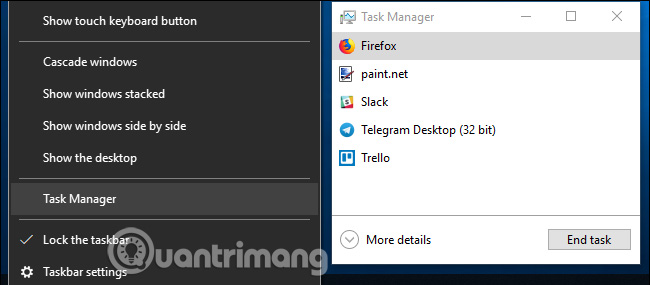
You can view GPU usage information for a specific application in Task Manager, although it is hidden by default. To view this information, open Task Manager by right-clicking on an empty space on the taskbar and selecting ' Task Manager ' or pressing Ctrl + Shift + Es .
Then, click on the ' More details ' option at the bottom of the Task Manager window if in standard, simple view.
In the full view of Task Manager, on the " Processes " tab , right-click on any column header and then turn on the " GPU " option. This will add a GPU column, giving the user the percentage of GPU resources that each application is using. You can also enable the ' GPU Engine ' option to see which GPU tool is using.

The total GPU usage of all applications on the system is displayed at the top of the GPU column. Click on the GPU column to sort the list and see which applications use the GPU the most at this time.
The number in the GPU column is the highest usage of computing applications on all GPU engines. For example, if an application uses 50% of 3D tools and 2% of GPU video decoding tools, you will see a 50% number appear in the GPU column of that application.
The GPU Engine column displays each application in use, indicating which application uses physical GPU and which tool. As the example above, you will know it is using 3D tools or video decoding tool. Users can determine which GPU corresponds to a specific number by checking the Performance tab.

How to view the video memory usage of the application
If you want to know the amount of video memory the application uses, you can switch to the Details tab in Task Manager. On this tab, click on any column heading and then click on the ' Select Columns ' option, scroll down and select the " GPU,' 'GPU Engine,' 'Dedicated GPU Memory,' and 'Shared GPU Memory' columns. The first two columns are in the Processes tab, but the following two memory options are only available in the Details panel.
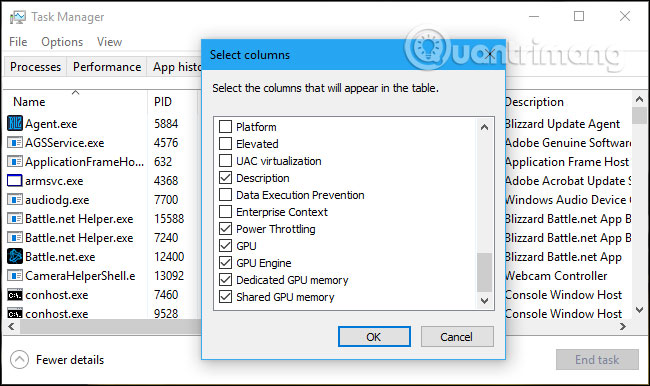
The ' Dedicated GPU Memory ' column displays the amount of memory the application is using on the GPU. If your computer has an NVIDIA or AMD discrete graphics card, this is its VRAM usage, ie the physical memory on the graphics card that the application uses. If there is integrated graphics, part of the RAM on the normal system is reserved for graphics hardware. It will display the amount of dedicated memory that the application is using.
In addition, Windows also allows applications to store some data on the system's regular DRAM memory. The Shared GPU Memory column displays the amount of memory an application currently uses for video features on the computer's normal system RAM.
You can click on any column to sort and see which applications use the most resources. For example, to view applications that use the most video memory on a GPU, click on the dedicated GPU Memory column.

How to monitor overall GPU resource usage
To track overall GPU resource usage statistics, click on the " Performance " tab and find the " GPU " option in the sidebar (you may have to scroll down to see it). If the computer has multiple GPUs, you will see many GPU options here.
If there are multiple GPUs linked (using a feature like NVIDIA SLI or AMD Crossfire), you will see them identified by " Link # '" in their name.
For example, in the screenshot below, the system has three GPUs. 'GPU 0' is an integrated graphics GPU from Intel. 'GPU 1' and 'GPU 2' are NVIDIA GeForce GPUs linked together by NVIDIA SLI. ' Link 0 ' means that both are part of Link 0.
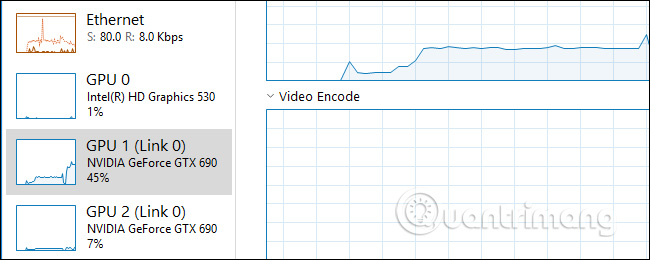
Windows displays GPU usage in real time here. By default, Task Manager displays the four most interesting tools according to what is happening on your system. You will see different graphs depending on whether you are playing 3D games or encoding videos for example. However, you can click on any name above the chart and select another tool to appear.
GPU names also appear in the sidebar and at the top of this window, making it easy to check the graphics hardware that the PC has installed.

You will also see graphs of separate and shared GPU memory usage. Separate GPU memory usage refers to the amount of GPU's own memory being used. On discrete GPUs, it is RAM on the graphics card. For integrated graphics, it is the amount of memory the system uses for graphics actually used.
Generic GPU memory usage refers to the overall amount of system memory used for GPU tasks. This memory can be used for common system tasks and video tasks.
At the bottom of the window, you will see information such as the version number of the installed video driver, created video driver data and the actual GPU position in your system.

If you want to see this information on a smaller window for easy viewing on the screen, double-click somewhere inside the GPU view or right-click anywhere inside it and select the option ' Graph Summary View ' . If you want to return to the original view, double-click the table or right-click it and remove the Graph Summary View option .
In addition, you can also right-click on the chart and select Change Graph To> Single Engine to view only one GPU tool chart.
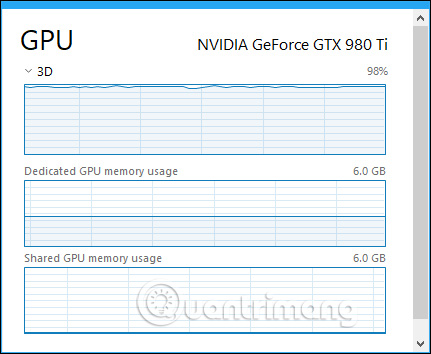
To always display this window on your screen, click Options> Always on top .
- 3 best ways to pin the window on Windows screen
Double click inside the GPU panel again and you will have a small floating window and position anywhere on the screen.

See more:
- Instructions for overclocking graphics cards for better gaming performance
- AMD and Nvidia - who is the king of GPU dominance?
- Combination of restart key GPU driver on Windows
- Top 10 tips for using Task Manager in Windows 10
- How to Open Windows Task Manager
- Instructions to fix Task Manager has been Disabled by your Administrator
- How to Enable Task Manager in Windows
- Experience the all-new Task Manager in Windows 8
- 11 ways to start the Performance Monitor performance monitor in Windows


 Create an audible alert when the GPU temperature gets too high
  7 ways to fix the error of not being able to enter the BIOS menu
  7 things you need to know about discrete GPUs
  Use GPU-Z to analyze graphics card parameters
  How to automatically overclock Nvidia GPU with GeForce Experience Performance Tuning tool
  How to reset GPU options for apps to default in Windows 10