10 best IP monitoring tools
There are IP surveillance software that makes it easy to monitor and manage your important resources. These tools seamlessly review, analyze and manage network traffic, interfaces and applications..
Network and surroundings are a busy place. Bandwidth battles for resource-hungry applications, security threats and the need for continuous uptime (activity) means that you will always be in control of performance, security and reliability. reliable of the network. But it's not always easy to keep track of these things.
But the good news is that there are IP surveillance software that makes it easy to monitor and manage your important resources. These tools seamlessly review, analyze and manage network traffic, interfaces, and applications. They provide you with in-depth reports on network and application performance.
Above all, other reasons for using IP monitoring software and tools include:
- Provides internal network control
- Identify slow applications and consume lots of bandwidth, so you can better plan for the development and procurement of new devices in the future.
- Detecting spyware, ransomware and other attacks caused by malware, before they invade the network, resources are important and become bigger problems.
- Detect the flow of personal information of customers. This is especially important if your organization is in the financial sector.
- Help with capacity planning.
The above list clearly shows that you need a comprehensive and reliable tool to monitor the network.
Below, you'll find a list of the best IP monitoring software and tools that can help you accomplish all of these tasks and more. These tools are highly appreciated by users and come with many comprehensive features, making IP monitoring a thorough and automated process. Some of these tools are free. Other options have a 30-day trial option and comprehensive support later.
Take a closer look at each of these tools and how they can help you monitor IP networks and servers.
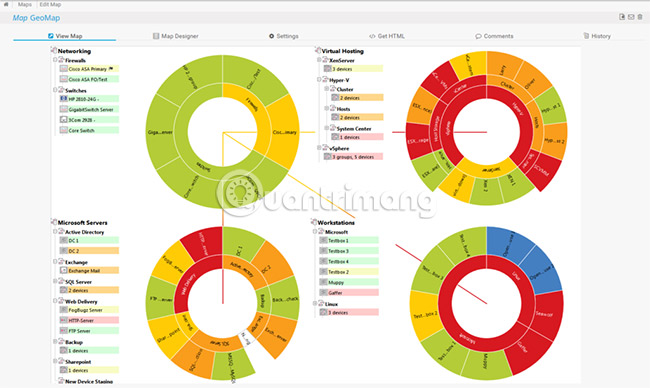
1. Solarwinds IP Monitor
Solarwinds IP Monitor is one of the most comprehensive IP monitoring tools from Solarwinds, one of the leading companies in network monitoring software solutions.
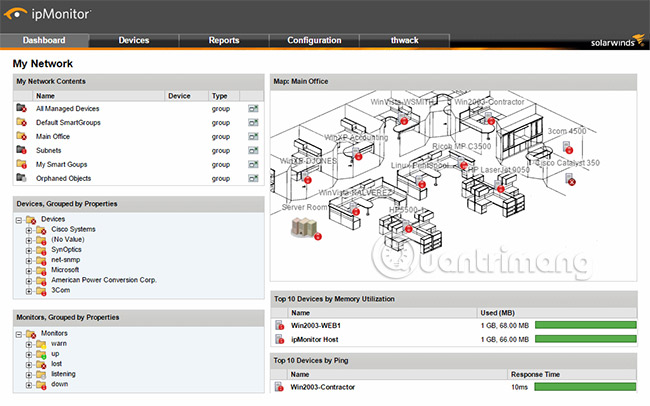
Main features of Solarwinds IP Monitor include:
- You can monitor different devices and applications from a single control panel.
- System requirements are minimal. In fact, there is no trouble creating and maintaining a separate database.
- Based on a proven agentless monitoring architecture.
- Send notifications for performance and usability issues. You can choose to receive notifications with multiple options, such as email, text messages and Windows Event Log files.
- Monitor network status on the map, so you can quickly drill down into the root cause of the problem.
- Automating corrective actions, so the downtime (downtime) is minimal
- Comes with an integrated reporting tool that allows you to create customized reports.
- Perform automatic device detection.
Download a 30-day free trial of Solarwinds IP Monitor.
https://www.solarwinds.com/ip-monitor/
2. PRTG
PRTG is an "all-in-one" monitoring tool by Paessler, a German company, specializing in the production of a wide range of network scanners and devices since 1997.
Below is a list of features available in PRTG:
- The center console gives you a comprehensive view of network performance.
- You receive a notification immediately if any metric is below the pre-defined threshold limit.
- PRTG pings all available IP addresses in your network and automatically starts tracking devices associated with these IP addresses.
- Comes with over 200 pre-configured sensors, to keep track of different metrics.
- Easily set up and start tracking immediately.
- Save time, effort and money.
- Compatible with all mobile devices
- Comes with an API for easy customization.
Price
PRTG's pricing model works slightly differently than other products. Here, the price depends on the number of sensors you add.
Prices for sensors are as follows:
- 100 sensors or less - Free
- 101 to 500 sensors - $ 1,600 (37,024,000 VND)
- 501 to 1000 sensors - $ 2,850 (VND 65,950,000)
- 1001 to 2500 sensors - $ 5,950 (VND 137,684,000)
- 2501 to 5000 sensors - $ 10,500 (VND 242,972,000)
If you want unlimited sensors, choose one of the following 2 packages.
- XL1 Unlimited - Any number of sensors on a main server installation. The cost is $ 14,500 (VND 335,533,000).
- XL5 Unlimited - Any number of sensors on 5 main server settings. The cost is $ 60,000 (VND 1,388,412,000).
The above cost includes one year of maintenance. To renew, you must pay 25% of the license fee.
Download PRTG.
3. ManageEngine OpManager
ManageEngine OpManager is a tool that ensures all your network devices operate continuously.
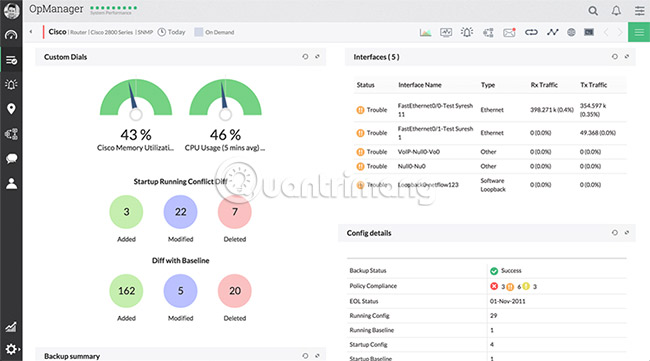
OpManager features are:
- Provide available statistics in real time.
- Keep track of different devices like switches, routers, servers and any other SNMP enabled devices.
- Provide detailed analysis of the performance of each device, so you can keep up with potential problems.
- Opmanager pings a device every two minutes and if the device does not respond after two pings, it will mark the device as unavailable. You can customize the number of pings and the interval between pings.
- Check device availability using ICMP Ping.
- Provide 4 different states to avoid false alerts. These four states are - On hold (to pause device monitoring), On maintenance (scheduled maintenance time), Parent Down and Dependent Down (stop checking dependent equipment when device 'parent' stops) work).
- Create a report on the scheduled date and time.
- Monitor availability of WAN links with Cisco IP SLA
- Support monitoring by WMI
- Monitor HTTP / HTTPS, sites based on Intranet, web server farm, web applications with login information, authenticated websites and more.
- Provides the option to remotely manage and monitor processes running on the server.
- Works well on Windows, Linux, Solaris, UNIX, HP, IBM, AIX, ESX and VMware server.
Download a 30-day free trial of ManageEngine OpManager.
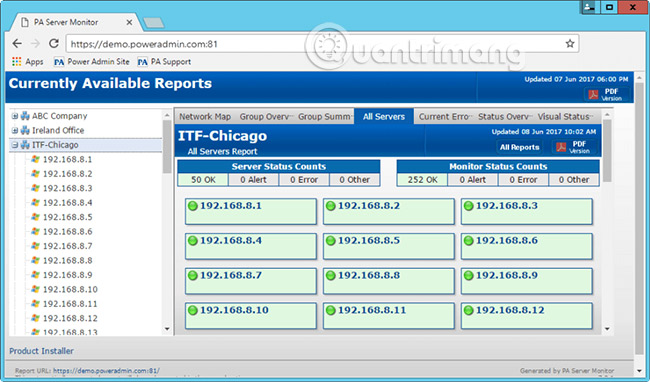
4. PowerAdmin
Power Admin is a powerful network and server monitoring software, reporting performance and availability of devices in the network.
Power Admin features include:
- Security monitoring of remote and local servers.
- Provide a full view of the drive.
- Provides proactive alerts, so you can fix problems before they get out of hand.
- You can view the report anytime and from anywhere.
- Track all Windows performance counters and SNMP objects.
- Fast and simple configuration. No script or configuration file is required.
- Help you know your network status all the time.
- Comes with a neat interface for mobile devices.
- The app dashboard is simple, easy to use, and most sections are quite intuitive.
- Provides agentless monitoring from a service.
- Monitor both Linux and Windows devices.
- Send data securely to remote networks using SNAP tunnels.
- Automate common IT tasks through Action Scheduler module.
- Monitor login and other security-related activities in Active Directory.
- Measure various parameters such as bandwidth, number of network errors and broadcast.
- Database Monitor modules monitor the activities on the database.
- Send a notice if there are any deviations from the normal level
- Email Monitor module monitors emails in POP3 and IMAP4 mailboxes.
- Event Validator Monitor module checks to see if any event was successfully executed. Some examples of events include backing up, updating an antivirus template file, etc. Sending a message if any of these tasks fail.
- You can execute custom scripts written in Visual Basic programming language.
- Regularly monitor the 'age' of files and warn them if they are too old.
Price
PowerAdmin offers multiple versions and price options.
If you choose to charge a subscription based subscription, you will be charged on the basis of the monitored device. Monthly cost is:
- 1 to 9 devices - $ 6 / device (139,000VND)
- 10 to 19 devices - $ 3.6 / device (83,000VND)
- 20 to 49 devices - $ 2.88 / device (VND 67,000)
- 50 to 99 devices - $ 2.10 / device (VND 49,000)
- 100 to 249 devices - $ 1.32 / device (VND 31,000)
- 250 to 499 devices - $ 0.72 / device (VND 16,700)
- 500 to 24,999 devices - $ 0.54 / device (VND 12,500)
- 2500+ - Contact the sales team
You can also choose to purchase a permanent license once. The price of this license is:
- $ 125 (2,892,000 VND) for the Ultra version
- $ 49 (1,134,000 VND) for the Lite version
- $ 99 (2,290,000 VND) for the Pro version
System requirements
The following things should be included in your system to install and run PowerAdmin
- Operating system Windows XP, 7, 8, 8.1 and 10.
- Windows Server: 2003, 2008, 2008 R2, 2012, 2012 R2 and 2016.
- Support both 32 bit and 64 bit operating systems.
- Internet Explorer 9 and above
- .NET 2.0 and above to create reports
- 50 to 500MB of physical RAM blank for tracking.
- 50MB to 50GB of disk space, depending on what is being tracked.
No registration or credit card required and all features are available for a limited time of 30 days.
Download the trial version of PowerAdmin.
5. VisualPulse
VisualPulse is a simple and powerful tool that ensures performance, as well as availability for network devices.
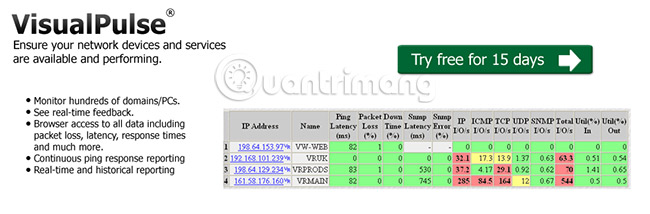
VisualPulse features include:
- Track hundreds of domains and PCs
- Provide feedback on performance and availability in real time
- Provide detailed information on a range of parameters such as latency, downtime, response time, etc.
- Continuous ping to report feedback. You can also change ping settings to suit your preferences.
- Create real-time and historical reports.
- Track the application port to report the availability of important services like SNMP, FTP, POP3 and DNS.
- There is original Unix support
- Alert mass events like backups
- You can configure the router's bandwidth limit
- Automatically traceroute logging
- Data can be exported to HTML or Excel for easy analysis
- Up to 400 IP addresses can be monitored at the same time
- Comes with web-based user interface for easy access
VisualPulse has two versions - Standard and Professional.
Download a free trial version of VisualPulse at:
http://www.visualpulse.com/download.html
6. Icinga
Icinga is an open source network monitoring application, originally created as a branch of the famous Nagios application. The idea behind Icinga creation is to overcome Nagios's shortcomings, as well as add new features to keep up with changes in the design and development of the IT industry.

Icinga comes with many interesting features including:
- Supports 3 different logging types: file logging, system log on LINUX / UNIX and console logs. You can also enable additional loggers.
- Icinga Data Output feature (IDO) exports all configuration and status information to the database.
- Icinga offers a full set of Nagios features.
- Maintain plug-in compatibility and configuration with Nagios, so moving between Nagios and Icinga is simple and easy.
- Network service monitoring such as SMPTP, NNTP, HTTP and POP3, resources such as disk usage, CPU load and server components such as switches, routers and sensors.
- Provide a simple plug-in design to help you develop your own service check.
- Provide parallel check services
- Determine the network server hierarchy through the 'parent' server.
- Detect, as well as distinguish between broken servers and unreachable servers.
- Determine the event handler that can be run in the service.
- Notify the contacts accordingly through various notification methods such as email, instant messaging and even through user-defined methods.
- Advanced alerts for other users or communication channels when needed.
- Two user interfaces - Icinga Classic UI and Icinga Web , provide you with comprehensive information about the availability and performance of different devices.
- Icinga's reporting module is based on Jasper Reports.
- Provide extensive information to help you plan your ability in the future.
- Provides performance graphs with the help of add-ons.
- Ideal for infrastructure at all scales
- Integration with many popular DevOps tools
Price: 100% free.
Download Icings.
7. Nagios
Nagios is a monitoring tool that comes with a simple interface. Many products have been built on this core engine and most notable are Nagios XI, Nagios Log Server, Nagios Fusion and Nagios Network Analyzer.
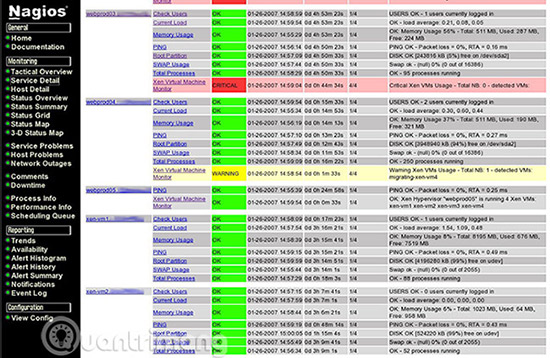
Nagios comes with the following features:
- Network monitoring to find problems caused by a variety of factors including data links and overloaded network connections.
- Support both agentless and agentless monitoring.
- There are over 5000 different add-ons available for Nagios.
- Quickly detect applications, services or handle problems.
- Significantly reduce the possibility of inactivation
- Provides tools to monitor not only the application but also its status.
- Monitor availability, uptime and response time of every node in the network.
Core engine Nagios for free. But you will have to pay registration fees for products built on them like Nagios XI and Nagios Log Server.
Download Nagios.
8. Zabbix
Zabbix is an enterprise-level monitoring platform that provides in-depth information about the performance of all devices on the network.
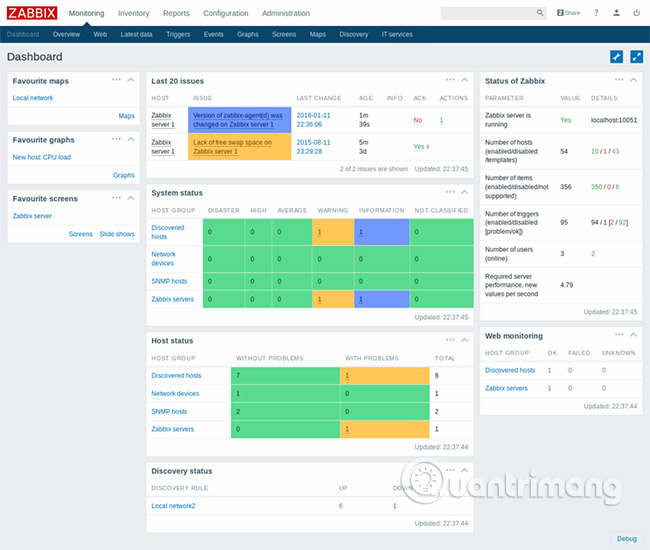
Zabbix features include:
- Collect data from any device, system or application.
- An original Zabbix agent runs on different platforms like Windows, UNIX and Linux to collect data like CPU, memory, disk space and more.
- Support for IPMI and SNMP agents.
- Execute custom scripts. This helps extend Zabbix's functionality because you can create scripts in Perl, Python and Ruby.
- Calculate and summarize different values to give you a comprehensive picture.
- Zabbix's web module can execute predefined scripts and store results. This feature can be particularly useful for web monitoring.
- Automatically detect problem state in incoming data stream. Separate analysis is not necessary.
- Predictive functions predict the possibility of an incident, so you can fix the cause even before the problem occurs.
- Provides flexible and smart threshold options.
- Provides historical analysis features
- Determine multi-level dependencies
- Support 6 classification categories, namely Disaster, High, Average, Warning, Information and Not classified .
- Comes with a widget-based control panel, allowing you the flexibility to choose the information you want to see.
- Display charts, network maps, slideshows and detailed reports.
- The user interface is very simple and powerful. It is the only place to have all the information you want.
- You can choose to allow Zabbix to automatically fix the problem.
- Notifications are customized based on the recipient's role and available information.
- Strong encryption capability between many different Zabbix components.
- Support multiple authentication methods, namely LDAP and Active Directory
- Comes with a flexible user rights scheme.
- Open source for security check.
- Install within minutes
- Creative templates are available for popular platforms.
- Support custom templates, with hundreds of templates built by the Zabbix community.
- Periodically scan and detect devices.
- Automatically create triggers, items and graphs for many different elements on a device.
- Start automatically tracking new devices without any prompt from the user.
- Ability to collect data from thousands of monitored devices.
- Monitoring even behind firewalls and DMZ
- Can run custom scripts on remote monitored servers
- High scalability for all IT environments
- Good integration with many third party software.
Zabbix has open source and 100% free usage.
Download Zabbix.
9. Pandora FMS
Pandora FMS is a complete open source surveillance solution, providing comprehensive information about network devices, servers and different types of applications.

Pandora FMS has the following features:
- Performance monitoring, as well as the availability of many different devices and applications.
- There is event-based management architecture.
- Support virtual infrastructure and cloud computing.
- There is API for SSO
- Intuitive control panel is highly customizable.
- Support geolocation, CLI management and LDAP authentication.
- Support up to 1000 agents in OpenSource version and 2,000 agents in Enterprise version.
- There are API libraries to integrate with third parties
- Multi-platform agents are available for Windows, Linux, HP-UX, Solaris and BSD.
- Provides support for multiple plug-ins in the Enterprise version.
- The role-based access control levels are supported.
- Comes with a compact web panel for mobile devices.
- Reports can be scheduled in the Enterprise version.
- Customizable and intuitive control panels are available in the Enterprise version.
- Support IPAM, SSH, SNMP, IPv6, WMI and Netflow.
Free OpenSource version, but you have to pay for the Enterprise version.
Download Pandora FMS.
10. OpenNMS
OpenNMS is an open source platform designed to build a variety of network monitoring solutions. There are two distributions in OpenNMS, Meridian and Horizon.
While the Meridian is ideal for businesses that need stability and long-term support, Horizon is where innovation is fast, thus ideal for monitoring new technologies and IT ecosystems.
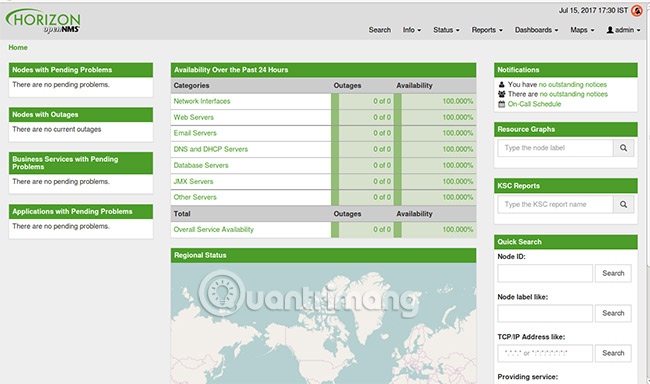
OpenNMS features include:
- Isolate issues to report really meaningful
- The test interval is changed automatically, depending on events such as power outages.
- Gather information from external sources.
- Comes with the SNMP hook
- Handle a variety of complex management tasks
- Use event-based architecture to provide alerts and notifications
- Send notifications across channels such as email, Slack, MatterMost, Jabber, XMPP, external scripts and APIs.
Horizon version is free, while Meridian version comes with annual subscription fee.
Download the Horizon version.
IP monitoring tools and software are essential to protect your company, valuable resources and warnings if there is a problem with any device, service or application in the infrastructure. network.
The tools discussed above are comprehensive and will give you all the information you need to keep up-to-date with what's happening in the network anytime, day and night. In addition, they help save you time, money and effort, as an organization, by minimizing downtime and really ensuring that all important production systems are operates at the most important times of the day / night.
Wish you can choose the right tool!