Learn about Activity Monitor on Mac
The Activity Monitor displays a variety of resources used on the system in real time, including processes, disk activity, memory usage and more.
Activity Monitor on Mac is equivalent to Task Manager on Windows. The Activity Monitor displays a variety of resources used on the system in real time, including processes, disk activity, memory usage and more, giving users a panoramic view of what What is happening on the Mac.
Today's article will show you how to use Activity Monitor. You will also learn how CPU, RAM and disk performance affect Mac performance over time.
What is the Activity Monitor? How to use this tool?
- How to open Activity Monitor on a Mac
- The basics of Activity Monitor
- Monitor CPU with Activity Monitor
- List processes by% CPU
- Get rid of unusual processes
- Tab Memory in the Activity Monitor
- Check if the Mac needs more RAM
- See Cached Files
- Swap Used and Compression
- Consider using energy with the Activity Monitor
- The meaning of the Energy control panel
- Activity Monitor's Disk control panel
- Meaning of Disk control panel
- Use the Network tab in the Activity Monitor
- The meaning of the Network dashboard
- Create a system diagnostic report
How to open Activity Monitor on a Mac
The Activity Monitor application is in Applications> Utilities . Navigate to this folder and double-click the icon to launch the application.
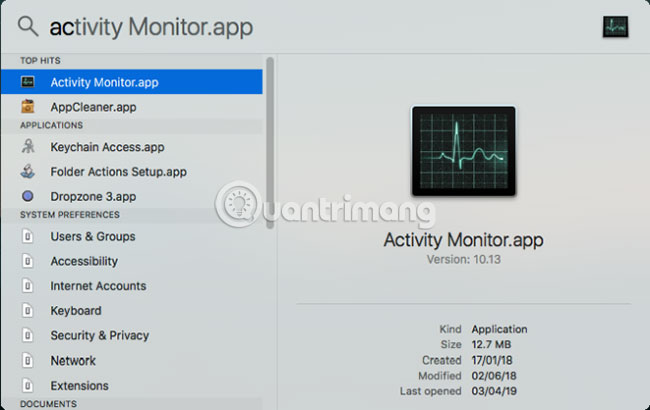
However, you can access this application (or any Mac application) faster by using the Spotlight search engine. Press Cmd + Space to open Spotlight. Then enter the first few letters of the application name and press Return.
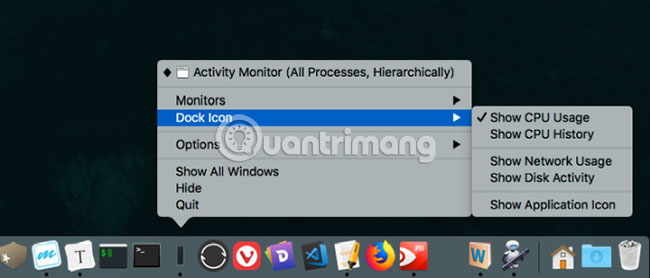
You can staple Activity Monitor in the Dock for easy use. Right-click on the application icon and select Options> Keep in Dock . You can even track important parameters right from the Dock. Select View> Dock Icon and select Show CPU Usage or Show CPU History .
The basics of Activity Monitor
The application's main window is an important process monitor. This window displays both the open application list and the system process. Some applications are easy to recognize, besides the system-level processes needed to run macOS.
Click on the column header at the top to sort the processes in ascending or descending order. In the upper right, the Search Filter box allows you to search for a specific process.
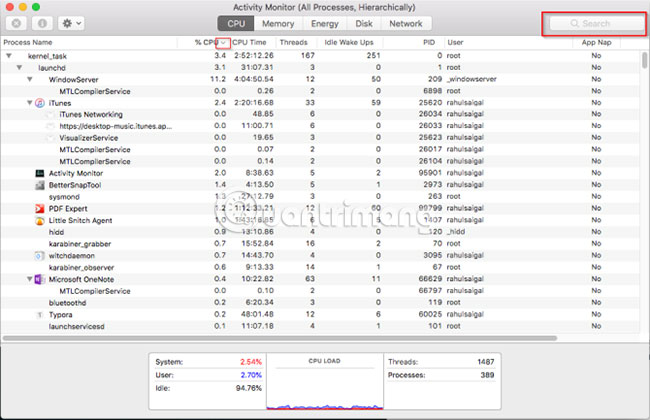
5 category tabs at the top of the window ( CPU, Memory, Energy, Disk and Network ) focus on specific data types. They are indicators that monitor the main system and provide valuable information for troubleshooting purposes. Each panel displays real-time statistics and resource usage charts over time.
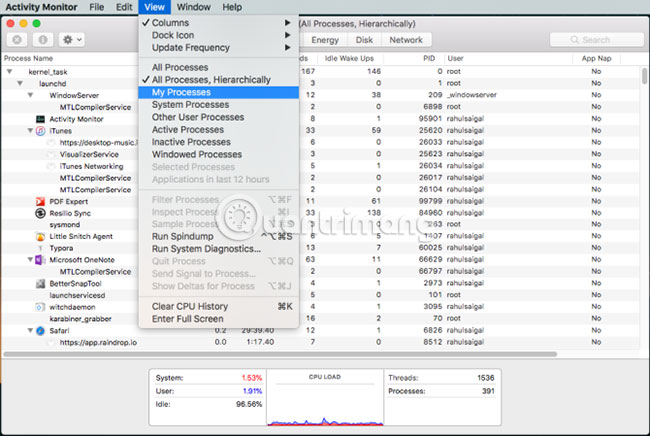
By default, the Activity Monitor displays only running processes for the current login user. To change this, select View> All Processes . You can also adjust the number of statistics displayed in columns and update frequency.
Monitor CPU with Activity Monitor
The CPU tab shows how all processes use the computer processor. You will see the total percentage of CPU that a process is using ( % CPU ), the time it operates ( CPU Time ), the number of times a process is 'awakened' from the Sleep state ( Idle Wake Ups ) , etc .
At the bottom, you will also see the percentage and graph of the CPU used by System (red) and User (blue).

List processes by% CPU
To see which processes are consuming too many resources, select View> All Processes and click the % CPU column to sort them by use. Some processes can sometimes show high CPU usage, but that doesn't necessarily indicate a serious problem. For example:
- The mds and mdworker processes related to Spotlight may show frequent CPU usage during the indexing process. This is perfectly normal for new Macs or recently formatted. The process will automatically end when completed.
- The kernel_task process uses a large amount of CPU. Kernel_task helps manage Mac temperatures by limiting CPU access to CPU-intensive processes. The kernel_task process usually consumes more CPU over time. Thankfully, you can fix kernel_task errors that take up multiple CPUs on a Mac.
- The web browser may display high CPU usage when users turn on too many tabs at the same time or display multimedia content such as videos.
Get rid of unusual processes
If an application is behaving strangely, unresponsive or having problems, the best option is to force the application to exit. In the Activity Monitor, you may see problematic processes written in red with the phrase Not Responding.
To end the process, select the application and select View> Quit Process or click the X button at the top of the toolbar to exit the process.
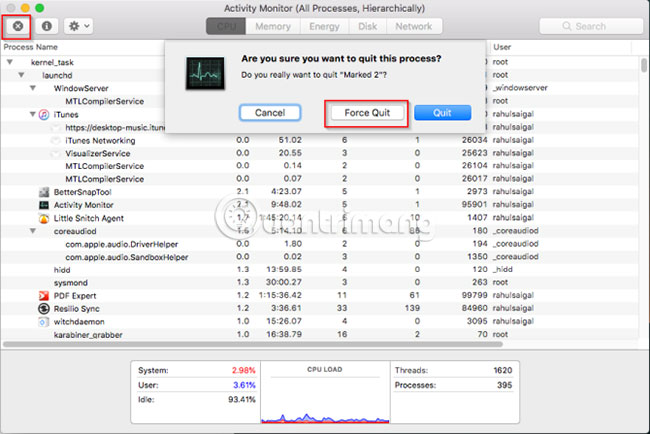
If for some reason, Activity Monitor doesn't work, try these steps:
- Press and hold Cmd + Option + Esc . Select the application you want to exit in the Force Quit Application dialog box and click Force Quit.
- Open the Terminal application. Enter > ps -ax , then press Return to list all processes running with PID (Process Identification) . To force the application to exit, enter > kill .
Note : You should never force system processes to close or ignore processes running as root. Instead, find out the cause by viewing the log or restarting the Mac to see if the problem disappears.
Tab Memory in the Activity Monitor
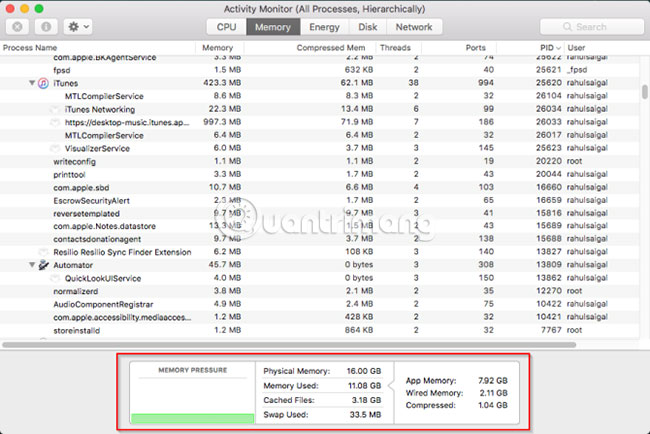
Tab Memory shows how much RAM the Mac is using. Along with the CPU, this is a key performance indicator for Macs. At the bottom of the window, you'll see a real-time memory chart with values that can help diagnose performance problems.
The Memory Used value is the total amount of memory used by all applications and system processes, divided into the following sections:
- Wired Memory: Processes must be in memory. They cannot be compressed or moved (from main memory to secondary memory).
- App Memory: Memory is allocated for all application processes.
- Compressed: macOS includes software-based memory compression to increase performance and reduce energy use. Mac compresses content used by less active processes, to free up space for more activities.
Check if the Mac needs more RAM
Memory Pressure chart displays the current state of memory resource usage through different colors. Green means having enough memory resources, and red means that the Mac has run out of memory and needs more RAM to work efficiently.
Yellow border is a warning sign. Check if an application is running out of memory and causes increased pressure on the memory. If the answer is correct, exit the application.
See Cached Files
Cached Files is another useful parameter, letting you know how much memory is currently being used by these applications, but is available for other applications. For example, if you exit Apple Mail after using it for a while, its data will become part of the memory used by cached files.
If you restart Apple Mail, the application will launch faster. But if another application needs RAM, macOS will automatically delete the data stored in the cache and allocate it to other applications.
If the files stored in the cache take up a lot of memory, don't fret about it. As long as Memory pressure remains green, you don't need to worry. You may need more RAM in the future, but before that, check out some common slow-down errors and how to speed up your old Mac.
Swap Used and Compression
These two parameters indicate how much process data is swapped into the boot drive or compressed to save space.Compression is preferred to swap because it gives you more storage space and doesn't slow down your Mac.
No problem if the Swap Used indicator is low, but if the index is high, the Mac doesn't have enough real memory to meet the needs of the application.
Consider using energy with the Activity Monitor
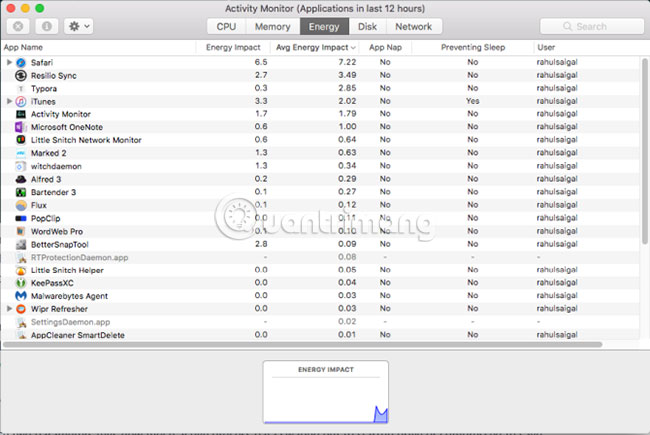
Every MacBook user is interested in battery life and always wants his laptop to run for as long as possible. Activity Monitor's Energy control panel is Mac's resource monitor. It shows the overall energy usage and by each application.
You'll see Energy Impact of running applications, along with Avg Energy Impact of each app in the last 8 hours or when the Mac boots up. The App Nap feature allows the Mac to put inactive applications into Sleep mode. This field tells you which application supports this feature and whether it prevents Mac from entering the Sleep state.
The meaning of the Energy control panel
The more energy-intensive the specific application, the less battery life will decrease. At the most basic level, you must check the Avg Energy Impact column to see which application uses the most energy over time. Exit those applications if you don't need them anymore.
For web browsers, you do not need to exit the entire application. Click the triangle next to the browser to expand the list of child processes. Find one of the most energy-intensive processes, then force the process to close.
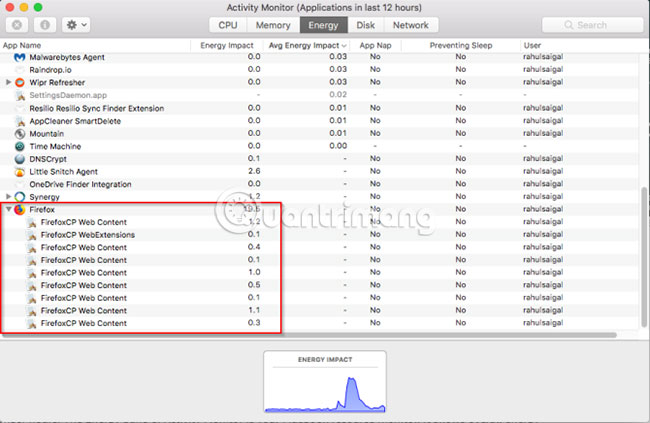
In general, it is tabs or plugins that consume significant energy. If you use Chrome, see how to control Chrome memory usage and free up RAM.
Activity Monitor's Disk control panel
The Disk control panel displays the amount of data each process has read from or written to the drive. It indicates the number of times the Mac accesses the drive to read ( read IO ) and write ( write IO ) the data. Blue shows the number of readings per second while red indicates the number of readings per second.
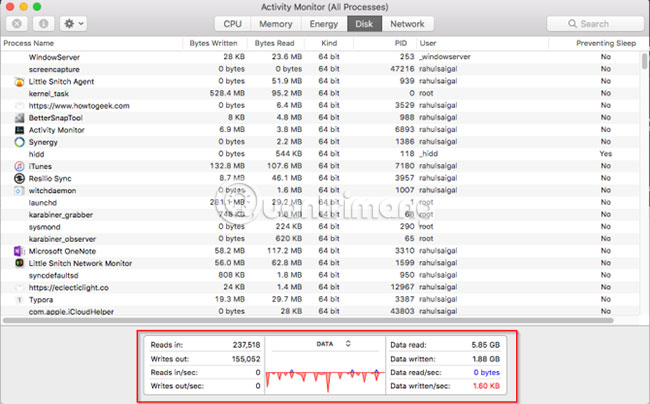
Meaning of Disk control panel
Having enough RAM is essential to ensure performance, but free space on the boot drive is also important for system stability. Pay attention to the number of reads or writes and observe how the system accesses read or write data.
If the drive's performance is high, is that correlated with CPU usage? Some applications or processes may cause both disk performance and CPU usage, such as when converting videos or editing RAW images. And if your Mac lacks RAM, you'll see frequent changes in disk performance.
Use the Network tab in the Activity Monitor
Network control panel displays the amount of data that a Mac sends or receives over a network. At the bottom, you will see network usage in packets and the amount of data transferred (red) and received (in blue).
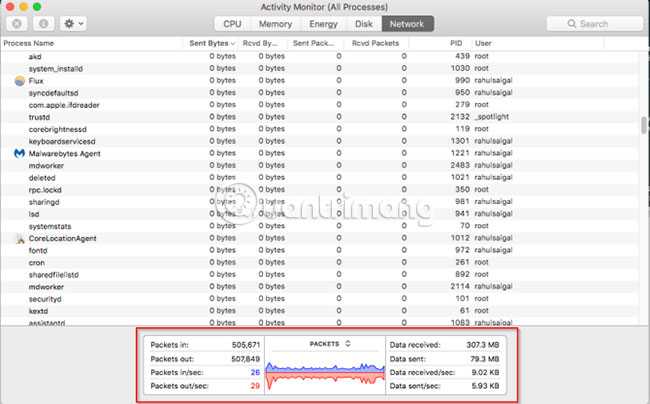
The meaning of the Network dashboard
In the Activity Monitor, you can quickly identify applications that transmit lots of data. Some natural processes create a lot of network activity, but some other processes are using many networks meaninglessly. Determining the external resources that each process is connecting will be very difficult.
If you are curious to see which process the packets are related to, use the Little Snitch application to monitor network traffic on a per-application basis.
Create a system diagnostic report
The Activity Monitor can also help you create a report about the state of your Mac. You can save the report and send it to a friend or Apple support to fix the problem.
To do this, select View> System Diagnostics . Wait a while for this process to complete.
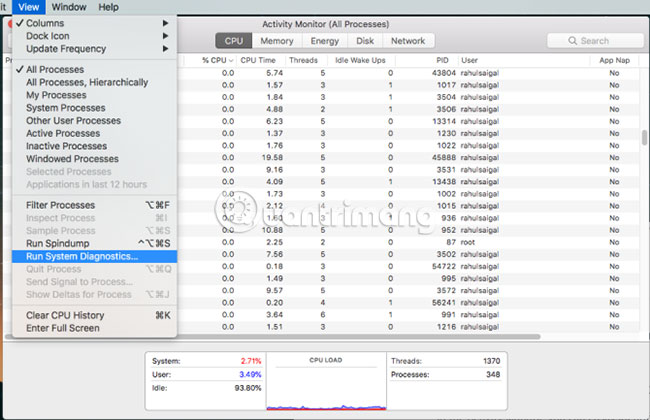
Activity Monitor is the macOS root task manager. By running this tool and following the advice that the article outlined above, you can find out why Macs are slow and the meaning of each parameter to overall system health.
If you have just installed new or performance RAM that is something unusual, you can analyze the system performance with a series of tests. Please see these benchmark applications to evaluate Mac performance.
Hope you are succesful.
- How to monitor GPU performance in Task Manager of Windows 10
- Experience choosing to buy the best computer monitor
- Where to buy a blood pressure monitor?
- Learn about the management and monitoring functions of Resource Monitor tool
- How to view computer usage history
- How to use sticker Activity on iPhone


 Review Samsung Smart Monitor M5 - Smart screen with many surprises
  How to use Remote System Monitor on Android to see Windows PC temperature
  How to work with Performance Monitor performance monitor in Windows
  Top 10 best bandwidth monitoring software
  Experience buying old computer monitors
  11 ways to start the Performance Monitor performance monitor in Windows