How to use Inspect Element in Firefox to check the website
Firefox's Inspect Element tool can help you check the operating background of a website, including the HTML, CSS elements used, latency of load elements and archives such as cookies.
Table of Contents
If you want to know the structure of the website, you can use the browser's Inspect service. On Google Chrome, there is a Inspect tool and in Firefox there is a similar tool. Firefox's Inspect Element tool can help you check the operating background of a website, including the HTML, CSS elements used, latency of load elements and archives such as cookies.
- 5 interesting HTML and CSS features to look forward to in 2018
Experienced developers may not see anything new in this tool, but new and everyday web users can find something interesting and new about Firefox's capabilities, files and The structure is hidden beneath each site in the Internet.
Install Inspect Element tool
If you use Firefox, you don't need to do any settings because this tool is already built into this browser. If you haven't used Firefox yet, you can visit its download page to download the latest version. Download the installation file as usual and double-click it or tap if on the smartphone.
Most Linux distributions come pre-installed with Firefox or have a copy in the package Software package so users can install it easily.
Open the "Inspect Element" tool
After installing Firefox, you can find its test tool by right-clicking on any element on the site. You will then see a drop down menu as shown below and select Inspect Element located near the bottom of the list.

How to component of Inspect Element tool
Tab Inspector
Click on " Inspect Element " to open the test tool at the bottom of the screen and it will display the Inspector tab. Turn on whenever you click on an element, it will be displayed in the middle of the tool and when hovering over that element, as the example in the illustration is the element
, Inspector will highlight the element on the screen in the web page.

This makes it easy to keep track of the elements being tested. In addition, it makes it easier to find different elements of the element. If you look to the right of Inspector you will see the properties of the tag
Still in this right panel, you will see properties that it inherits from other elements. You can even change properties in this window and see how they appear on the web in real time.
Tab Style Editor
Next you can discover Cascading Style Sheets (CSS) by clicking on the Style Editor at the top of the toolbar to open a new dialog, displaying three new tables at the bottom of the screen.

Here you can see two DuckDuckGo style sheet files used as elements of the first selected style sheet and different '@media' rules of that sheet, adjusting the response design for smaller screens and bigger.
You can edit these two style sheets as in the 'Inspector' section. In this case, you can select a lot of rules among the 1262 rules in the first style sheet.
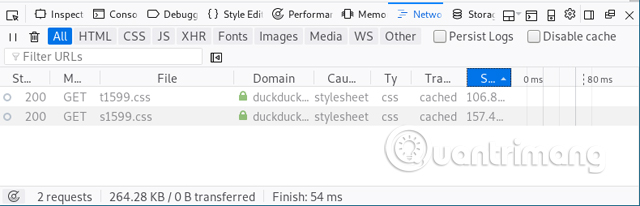
If navigating to ' Network Monitor ' in the toolbar, you will see the site requirements for these files and its status. Other elements such as images and fonts can be displayed in this tab and you can see all those requests and the size of each file after the request is processed.
Tab Performance
When you open the Performance tab, you need to click the Start Recording Performance button to get the Inspector to collect information. After a few seconds, it will discover the frame rate per second (FPS) of the web page running, Document Object Model (DOM) events taking place and recalculate the properties according to style recalculation rules (CSS) with the loading time of elements (usually in milliseconds).
- The best website load testing tools available today
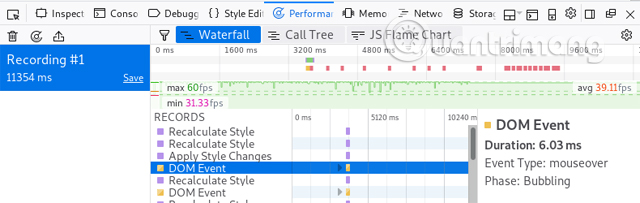
For this site, you'll see DOM events highlighted, hover over, take 6.03 milliseconds to load, the average speed of this site is 39 FPS and the graph displays the time range. Feedback reaches 9000 milliseconds for some events.
Tab Memory
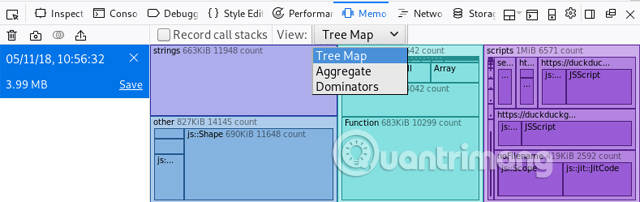
In the Memory tab, you also need to click the Take Snapshot button to collect information. In this example, it collects an event map, showing that there are approximately 600 KB strings, 1MB objects, and 1MB scripts that find their way into memory. You can perform different ways to view the same elements by clicking on the drop-down menu and selecting Tree Map as shown below.
Tab Storage
Finally, when you click on the Store tab, you will see a number of permanent files that the website on your computer is cookies.
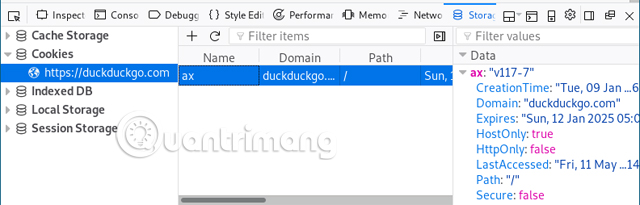
Looking at the image above, you can see in the right panel, this specific cookie expires in the middle of the next decade (ie January 12, 2025).
There are many things you can explore with this Inspect Element tool. Take a moment to change the web page's HTML element, visit a few different websites to see its download time, search for the number of cookies a particular website stores on your device, etc. .
Hopefully this tool will help you better understand the structure and components of the website so that it can understand or start the path of writing your code.
See more:
- Inspect Element: How to temporarily edit any website?
- Free website analysis tool
- Instructions on how to check website life
Was this article helpful?
Your feedback helps us improve.
Related Articles
 Inspect Element: How to temporarily edit any website?23 minutes read
 Open Inspect Element and View Source on Microsoft Edge browser3 minutes read
 Introducing the Adobe Edge Inspect tool3 minutes read
 How will your website look on mobile?1 minutes read
 How to check for extensions will stop working in Firefox 573 minutes read
 How to check website IP address / domain name4 minutes read
Reader Comments 0
Sign in with email or Google to join the discussion.