Inspect Element: How to temporarily edit any website?
Right-click on any web page, click Inspect, and you'll see everything inside of that site, including: designed source code, images and CSS, fonts and icons that the page uses. and animated Javascript code, ...
Right-click on any web page, click Inspect, and you'll see everything inside of that site, including: designed source code, images and CSS, fonts and icons that the page uses. and animated Javascript code, .

On your browser there is an extremely powerful hidden tool: Inspect Element.
Right-click on any web page, click Inspect, and you'll see everything inside of that site, including: designed source code, images and CSS, fonts and icons that the page uses. and animated Javascript code, . You can also see how much time it takes to load web pages, how much bandwidth to download and the exact colors used on the text of the site.
Alternatively, you can use Inspect element to edit any website you want.
Inspect element is a perfect way to learn how to bookmark websites, find vulnerabilities and errors on your site, find out what color and font changes will look like. It's a super powerful tool on the browser that you've never known.
Find out how to use Inspect Element to support your work, whether you are a developer or simply learn to get more information about Inspect element.
1. Why should I use Inspect element?
If you are curious about the code of a website, you will probably wonder how to use Inspect element.
- Designer: Want to preview how a website is designed to display on a mobile device?, Or something . You can do it within seconds with Inspect Element.
- Marketer : If curious about the keyword (keyword) that your competitors use on the title of the page or if you want to check the speed of Google's page load? Inspect element can display all these things.
- Writer : If you're having a headache about blurring your name and emal address on the screenshot? With Inspect element, you can change any content and text on the web in just a few seconds.
- Support Agent: If you need a better solution for developers to fix their site. Inspect element allows you to make a change example to quickly show what you are saying.
Inspect element is a useful tool for you, which is part of the Developer Tools tool on your browser. The tool includes a number of features: a console to run code, a Source View page to view the Raw Code behind a web page, a Soure page (source page) with a list of all files loaded on. a website,.
Here's how to use the main Element tab to refine a web page.
2. Start with Inspect Element
There are several ways to access Inspect Element on Google Chrome. Just open the website you want to edit, then follow 1 of the 3 ways below:
- Right-click anywhere on your site, and the bottom of the menu appears a popup window, where you will see Inspect , your task is to click Inspect .
- Click the serrated icon (or the 3 dash icon) in the top right corner of the screen, click More tools => Developer tools .
Or another way is on the File Menu => Developer => Developer Tools .
- Press Command + Option + I (for Mac) or press F12 on Windows computer to open Inspect Element without clicking any further steps.
By default, the Developer Tools will open a table at the bottom of your browser window and display the Elements tab.
Click on the 3 dots icon to align on the Inspect element panel (near the X symbol). You should now see the option to move the panel to the right of the browser window or to open a separate table.
In the above example, open the Inspect element panel on the right side of the browser window. You can expand or collapse or expand the Developer Tools table by moving the mouse to the left of the border.

When the "<–>" icon appears, drag the icon to the left pane to expand the table or drag to the right to narrow it.
On the Inspect Element window, there are a bunch of useful tools that you can use to create websites. In this tutorial, the Network Administrator focuses on three tabs, Elements, Emulation and Search tab.
- Tab Search:
The Search tab allows you to search for a site with specific content for an HTML element. Click on the 3 dots icon, then click Search All Files to display the files. And now you can search for important files on the website you want.
- Tab Elements:
Inspect element is the tool we will learn most in this tutorial. Click on the Elements tab on the Developer tools to return if you are exploring other locations.
In the Explore tab, you can see all the HTML, JavaScrit and CSS integrated on the site. It is like viewing the source code of a web page, but there is another point here that you can make any changes to this code and see real-time changes on the website you have opened.
You can change anything on the copy like font, take a screenshot or save your changes (just go to View => Developer => View Source and save the page as an HTML file, or Copy the code changes to the text editor After reloading the page, all your changes will disappear.
- Tab Emulation:
Have you ever wanted to view a web page on your mobile phone without having to pull out your phone? The Emulation tab lets you view a web page the same way you view a web page on any device, with settings on popular devices or an option to set screen resolution and aspect ratio. You can even set up internet speed simulation to see how quickly you load a web page.
However, Emulation is hidden, so you must activate it by opening Inspect Element, pressing the Esc key then selecting the Emulate tab and activating the Enable Emulation button to activate.
3. Search for anything on the site with Search
If you want to find anything exactly on your favorite website, Search is the best tool for you. In addition to reading the entire source code of the website, you can open the default Elements view, press the C key combination trl + F or Command + F and search through the source code. However, the full Search tool allows you to search through files on the page, help you search for text within CSS and JavaScript files, or specify the image icon you need for an article.
To get started, open Zapier.com on your Chrome browser if it is not already available, then open Inspect Element, click the 3 dots in the top right corner of the Developer Tools panel window (near the bookmark icon) X), then select Search All Files. The Search tab is displayed in the bottom half of the Developer Tools table.

At the Seach frame, you can enter anything you want to find on the site and the information you need will appear on this table.
Enter meta name in the Search box and press Enter, you'll immediately see all meta names appear on the code on this page. Now you can see if the metadata of the page is correct, the SEO keyword will be the destination and see if it is configured for Google Index to search. This is a simple way to see what your competitors are targeting and to make sure you don't miss anything on the page.
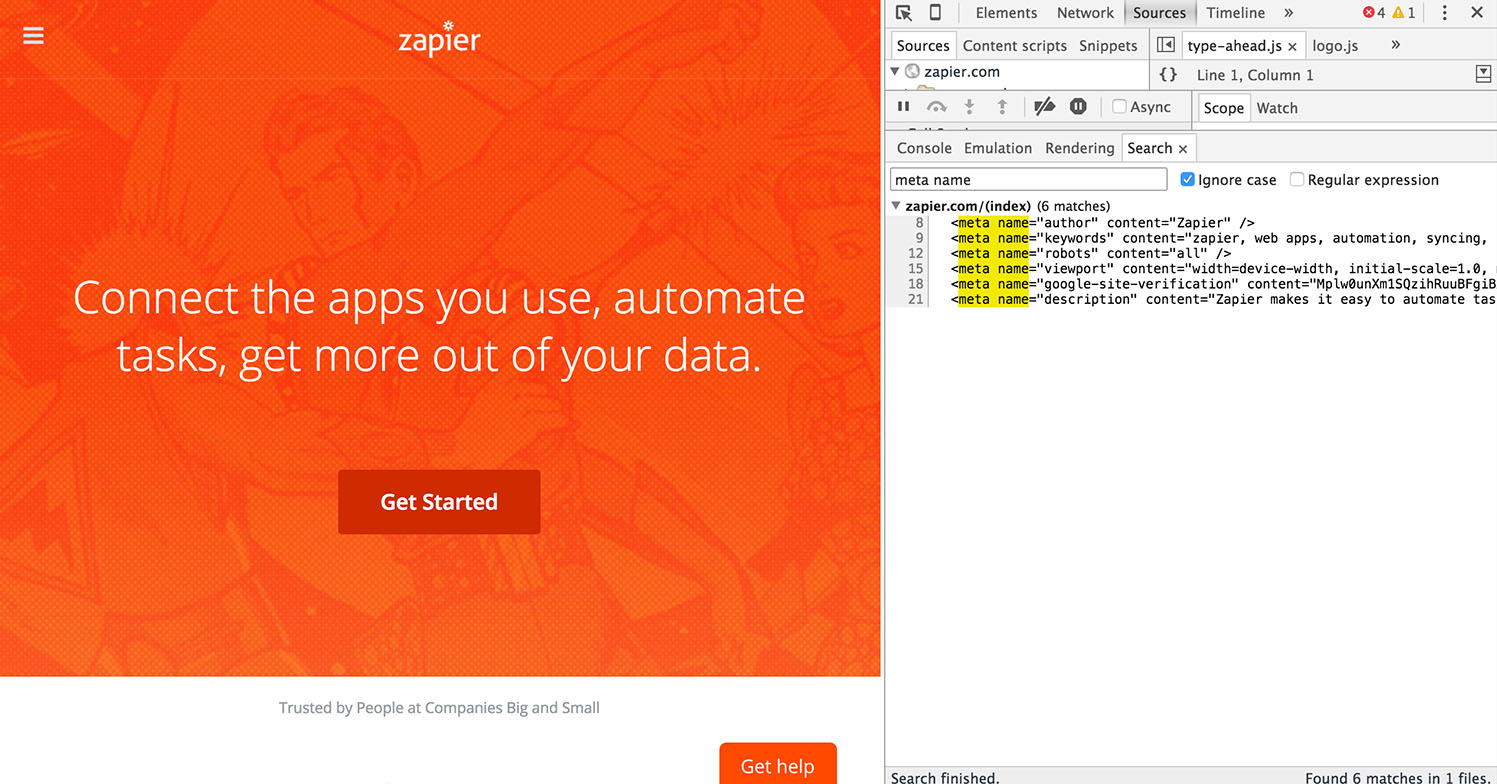
Next try another query. Delete meta name , then enter h2 in the Search box and press Enter. You will see the locations appear h2 on Zapier's JavaScript files in the top corner, but after scrolling down you can see h2 on the page title.
Search is a useful tool for developers, because you can also search by color. Enter # ff4a00 in the Search box and press Enter (and make sure you have ticked Ignore case to see all search results).
Now you can see the location of the # ff4a00 colors, Zapier's orange colors on the CSS and HTML file pages. Then click on the line 'color: # ff4a00;' to jump to the line on the HTML page, and you can fine-tune it as you like.
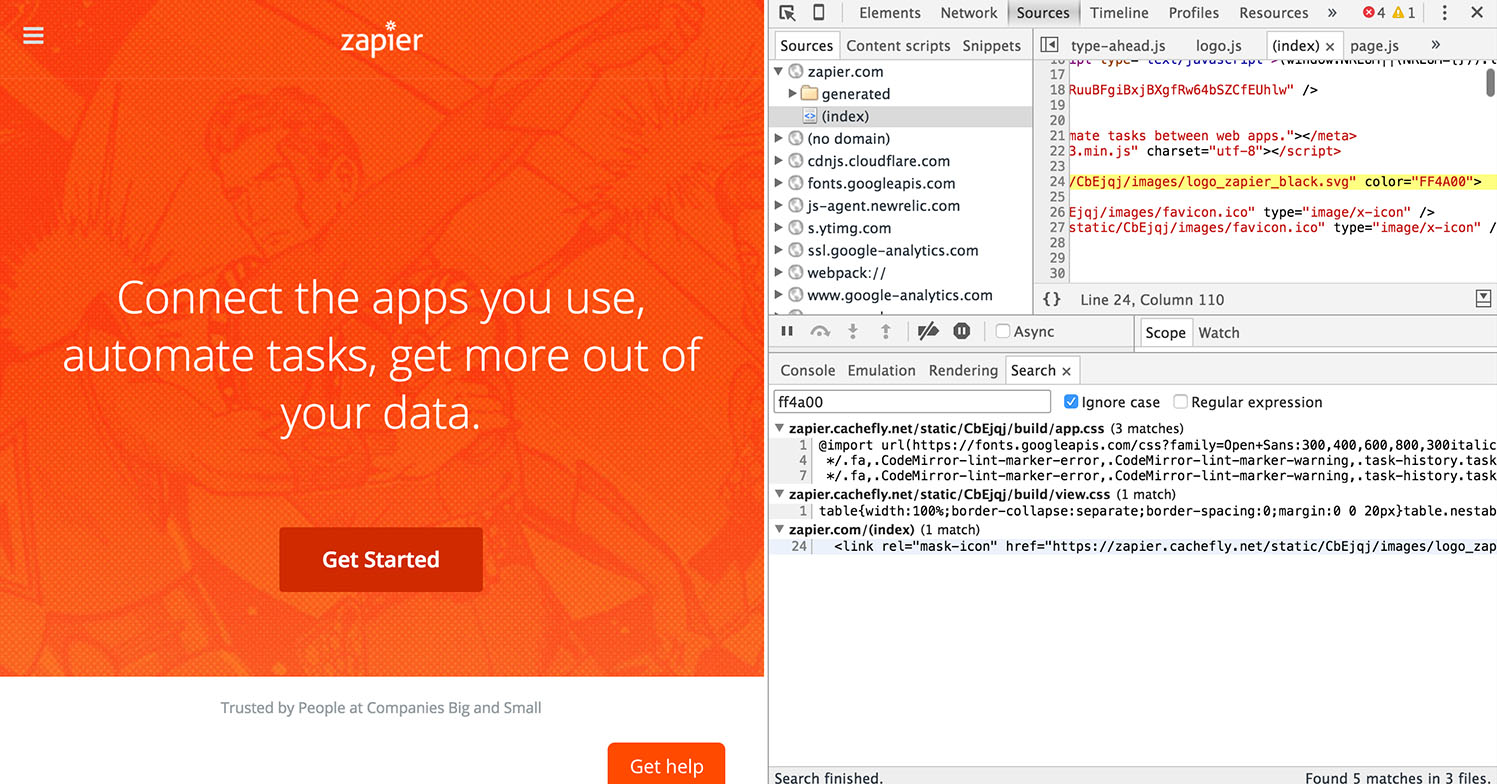
This is the most effective solution for designers to ensure that the website is designed according to their brand style. With the Search tool, designers can easily check the CSS of a website to find out if the wrong colors are applied, or the wrong fonts are used on the website or if you still use it. Old colors on certain locations on the site.
In addition, the Search tool is also the perfect solution for developers to communicate better, because you can show them exactly where you found the error or the exact location to change. Just tell them the number of lines with errors and they can fix them quickly.
Or you can change the site with Elements, the core of Chrome's Developer Tools.
4. Change anything with Elements
The font-end developer is used on Inspect Element everyday to edit the external display of a website and test new ideas. Elements also allows you to fine-tune the external display of a web page and the content of the web page by adding an edit to the site's CSS and HTML files.
After closing or reloading the page, your changes will disappear, and you will only see changes on your computer. This way you can freely experience and change anything, then copy and save the best changes to reuse in the next time.
Let's see what we can do:
Click on the Elements tab on the Developer Tools panel, and if you want to zoom in, press the Esc key to close the Search frame you opened earlier. And you will see the HTML code of the page.
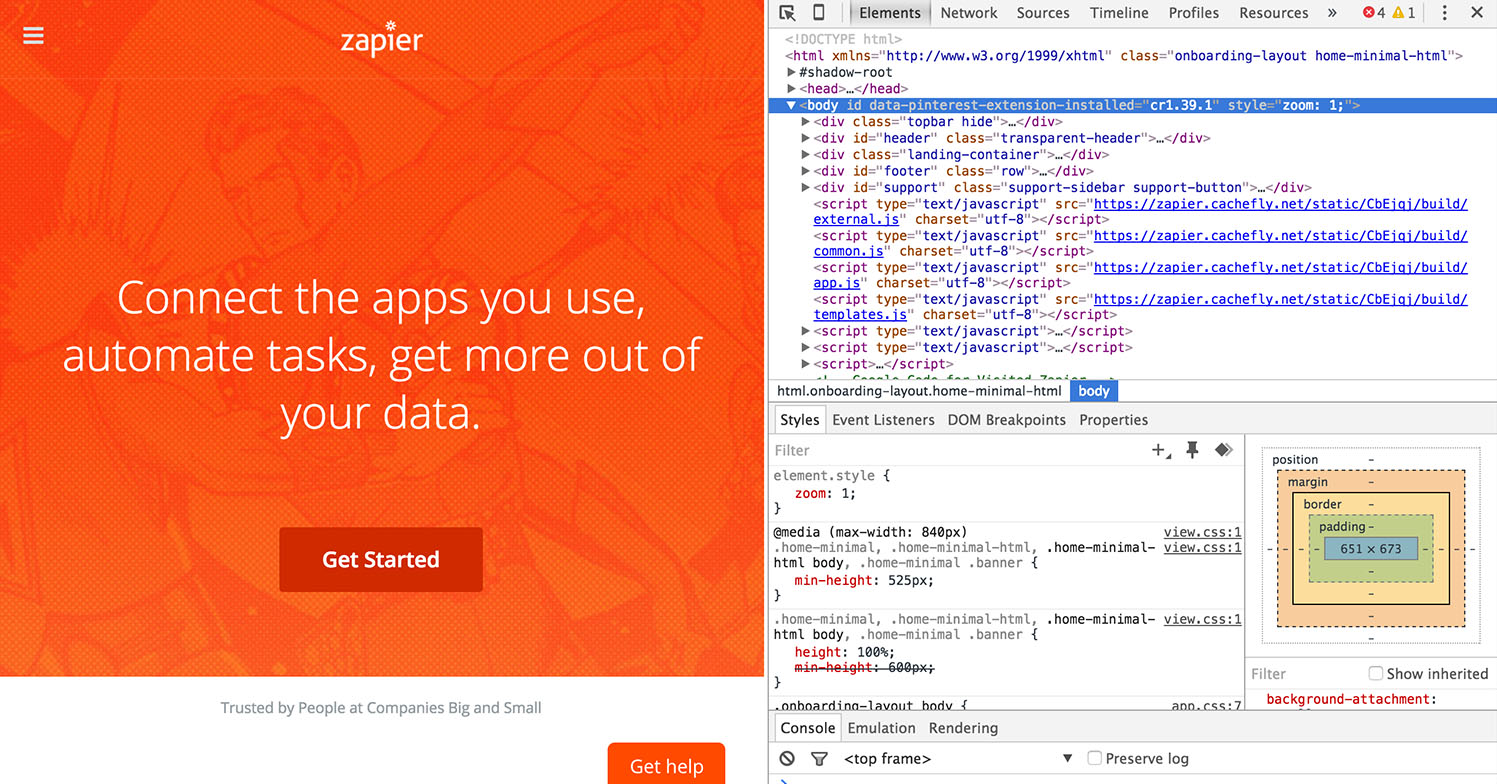
In the top left corner of the Developer panel, you will see a mouse icon above the same square. Your task is to click on that icon, then select any element on the page you want to change. And everything will change.
5. Change the text on the website
Even if you want to change the text on a web page or if you want to delete your email address on a screenshot, you can do all of this.
Click on the mouse icon on the square, then click on any text on the web page. On the Developer Tools tool panel, you will see that the text is highlighted in green as shown below:
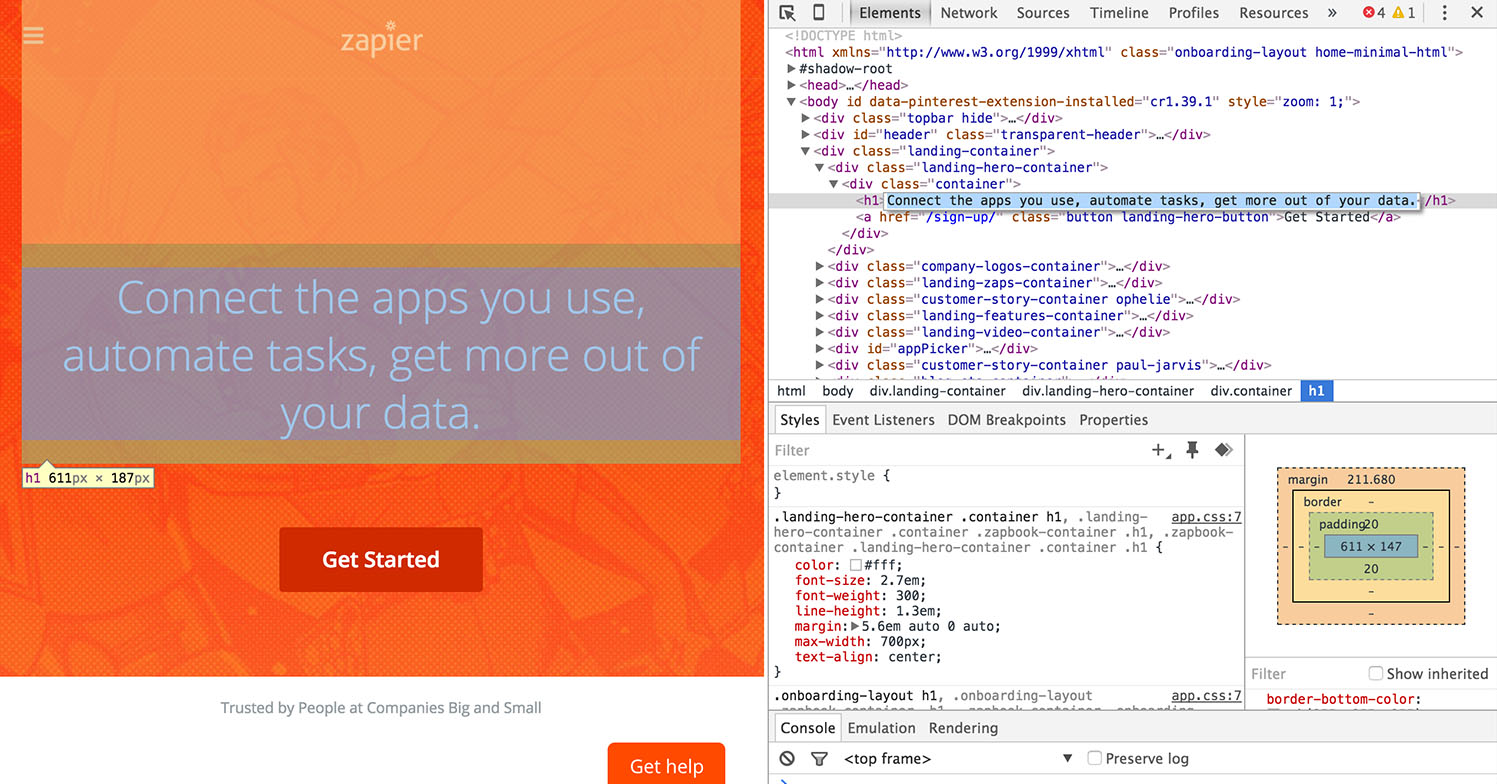
Double click on the text highlighted in blue "Connect the apps you use" on the Developer Tools panel and a text edit box will appear.
Enter any content you want into the text box and press Enter. And so you have finished changing the text on the website.
Refresh your site and everything will return to "normal" status.
The Developer Tools panel will also reload the same page, but now you can close the Developer Tools tool panel by clicking the X icon in the top right corner of the page.
You will now open the backup. All you need to do is right-click anywhere on the page you want to edit, then click on the Inspect link or the Inspect Element link that appears in the corner below the right-click menu.
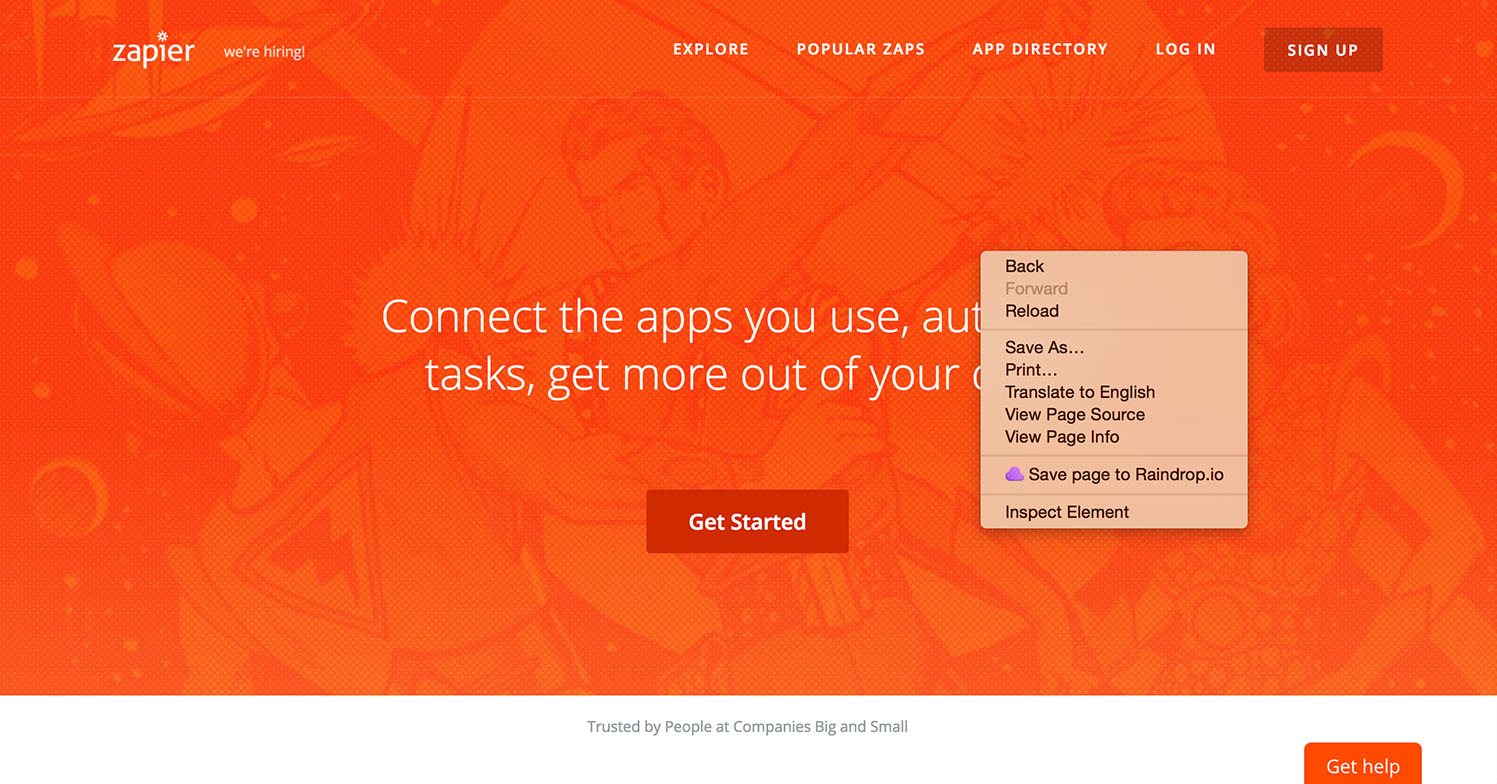
When the Developer Tools tool panel opens, it automatically sets the black mark to that sentence.
6. Change the color and font of Elements
On the right side of the sentence on the Developer Tools panel, you will see a sub-table with 3 more tabs attached: Styles, Computed and Event Listeners. Each tab allows you to change how the sentence appears on the page. First start with the Styles tab.

On this tab you will see some lines crossed. This means that these styles are not active for the selected element, so changing these values doesn't matter.
Continuing with the selected sentence, we will find the "text-align" attribute at the Styles tab.

You can see it is set to "center", double-click "center" and enter "left" to arrange the content horizontally to the left of the page.
Next is the color.
Under the tagline of the Zapier homepage you will see an orange login button. Take steps to change colors. Select the button by right-clicking then selecting Inspect element or simply clicking the arrow icon on the square, then clicking the button.
You can understand the Tagline as a slogan or a short, easy-to-remember and vivid phrase that summarizes a company or a product.
In the Style tab, find the line named as below:

Double click on "# 4199ad" , enter # FF4A00 into it and press Enter.
And the color of the button has been changed.
7. Change Element States
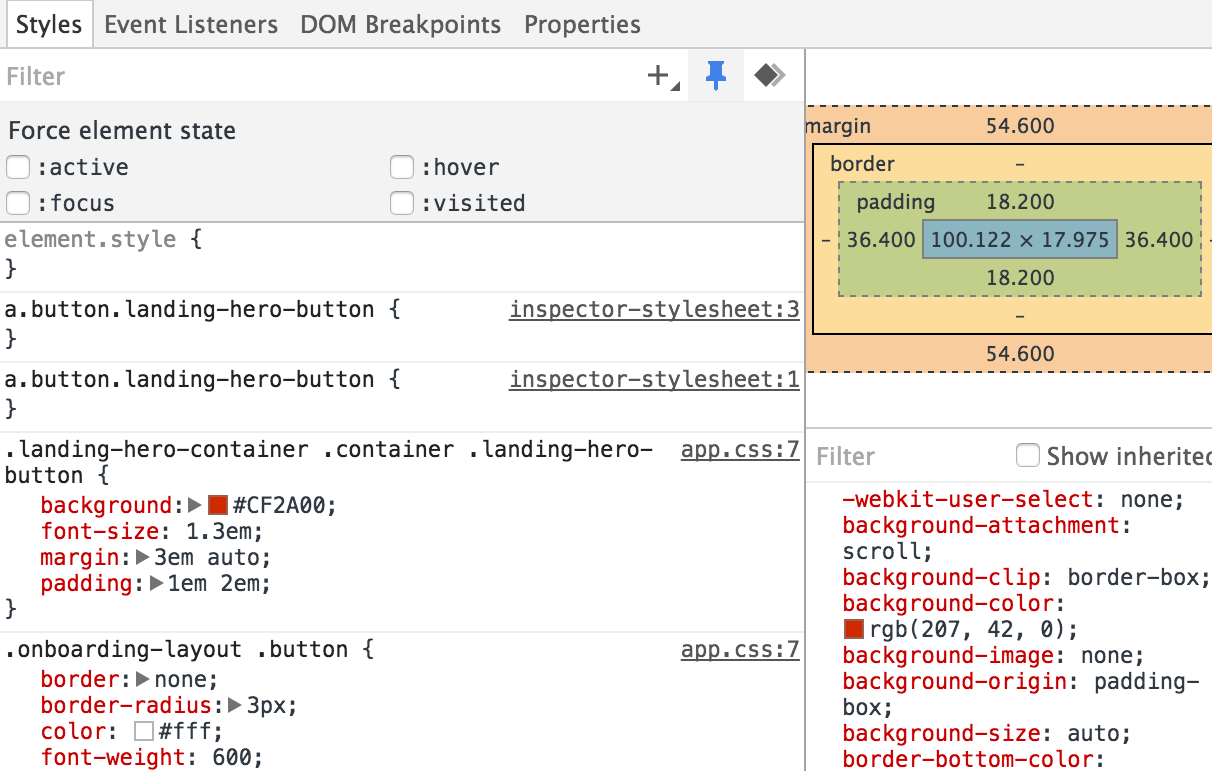
At the Styles tab, you can see the pushpin icon in the top right corner. Your task is to click this pushpin icon and a small "force element state" table will appear.
This table allows you to display the different states of any element (especially links and button buttons). You can also see what the element will look like if there is a "hover" visitor (hover state), select the element (focus state), or click the link (visited state).
Let's test and see the results. First, make sure you have selected the login button on the Zapier home page. Next click on the "hover" option at the "force element state" section , and double-click on the background color value.
Now you can change the background color value to # FF4A00 and immediately the login button color will change. Uncheck the selected Hover entry, then hover your mouse pointer over the login button and you will see that the hover state has changed.
8. Change the image
With Inspect Element, you can easily change the background wallpaper on your website. Try changing the Superhero background on the Zapier page with NASA's sun-light image.

First copy and paste the link below into the image:
https://c1.staticflickr.com/9/8314/7931831962_7652860bae_b.jpg
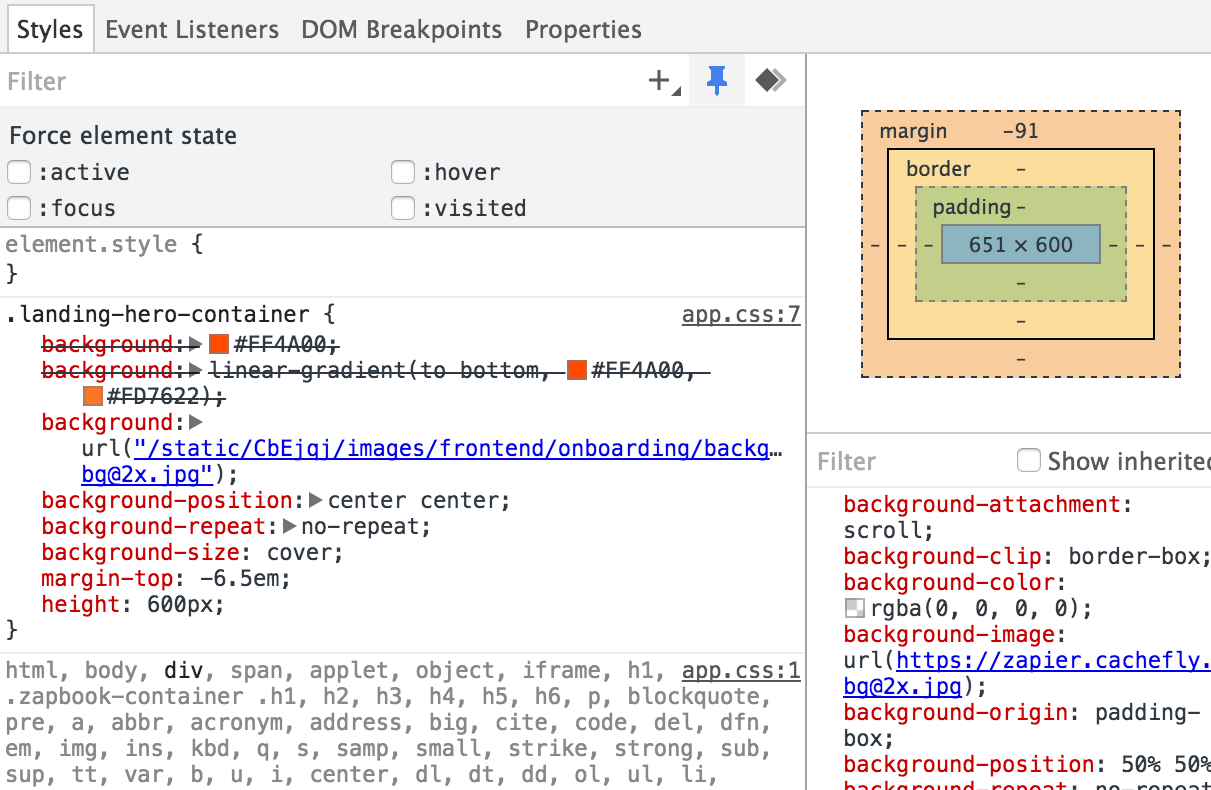
Next open Inspect Element on the background of the Zapier homepage and make sure you've selected the landing-hero-container line on the code. Double click on the link URL Background on the Styles panel and paste the link you copied above.
Press Enter and the result will be displayed immediately.
Note:
You can also change the image with a GIF or a video, all you need is a link file and you can add it.
9. Check the website on any device with Emulation
In the era of explosive technology like today, you can access websites not only on computers but also accessible on other devices such as mobile phones, tablets (tablets), TVs. .
Emulation is a great tool that you can use to test, check how your website appears on different devices and browsers.
On the Developer Tools panel you will see a small mobile phone icon located in the top left corner. Click on that icon. This will change something on the page:
1. You will see several options and black ruler on the web page as shown below.
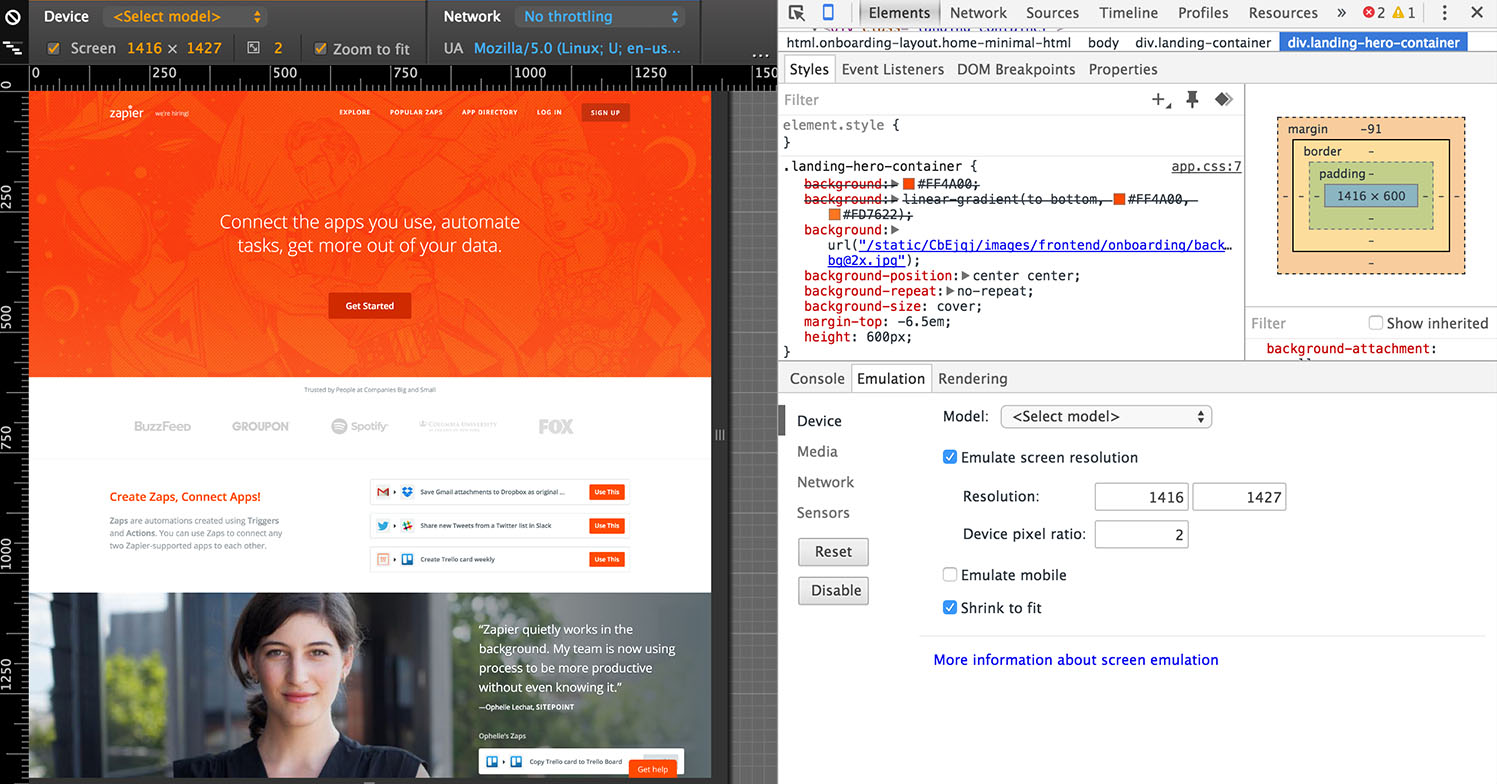
2. You will see the new Emulation section on the Developer Tools panel (if Emulation is not visible, press the Esc key and then click the Emualtion tab).
To start, click the Enable emulation button on the Developer Tools panel. Here are four emulation options: Media, Network, Device and Sensors.
See what are the 4 options for doing these tasks?
- Media:
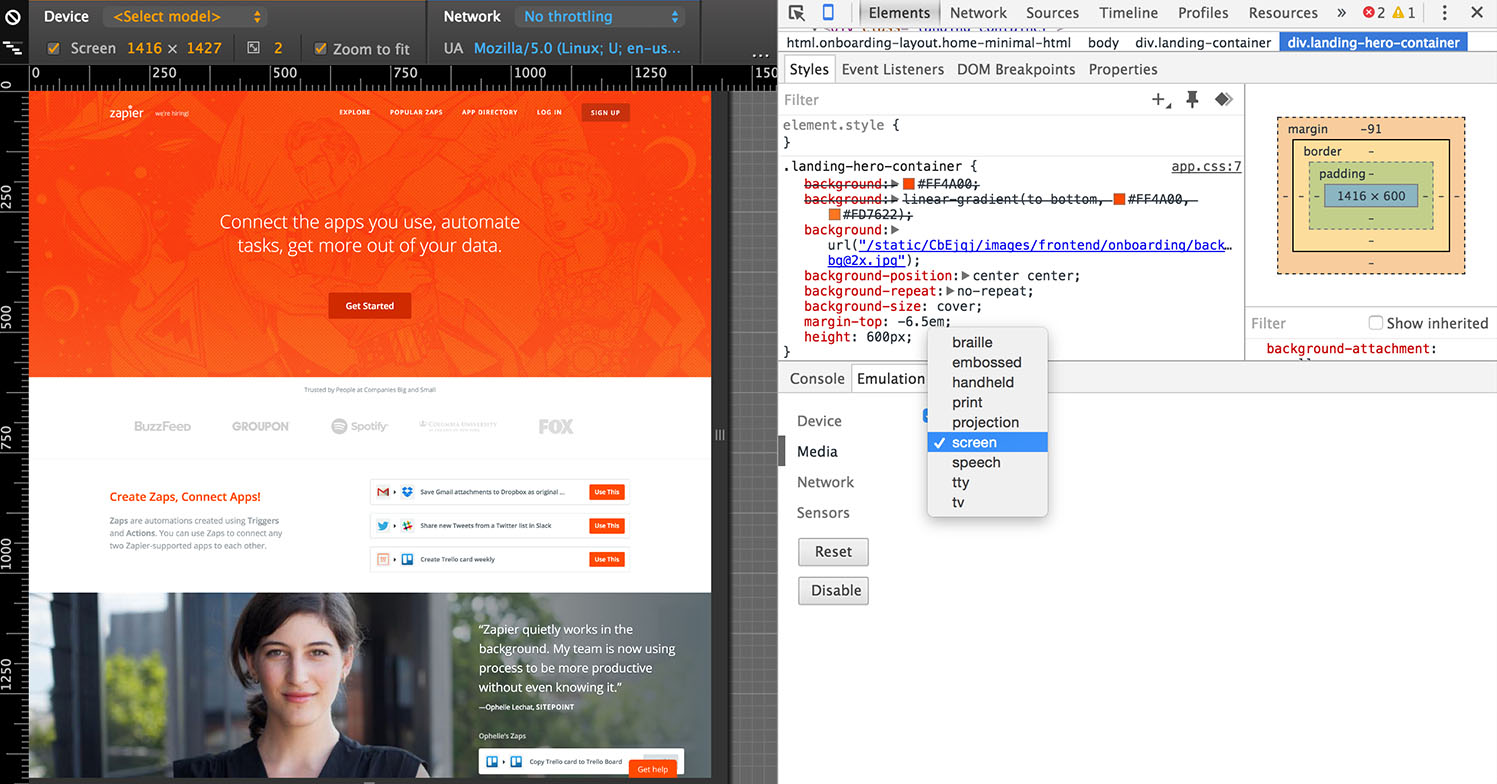
Media displays how the web pages will look on different media and devices: on the projector, when printing on paper or on devices that are allowed to connect.
Each site will have different interfaces if the page is used on many different communication devices. And if the site has many different interfaces, you can view them here.
You can then explore how to change different scenarios and refine your style to your liking.
- Network:
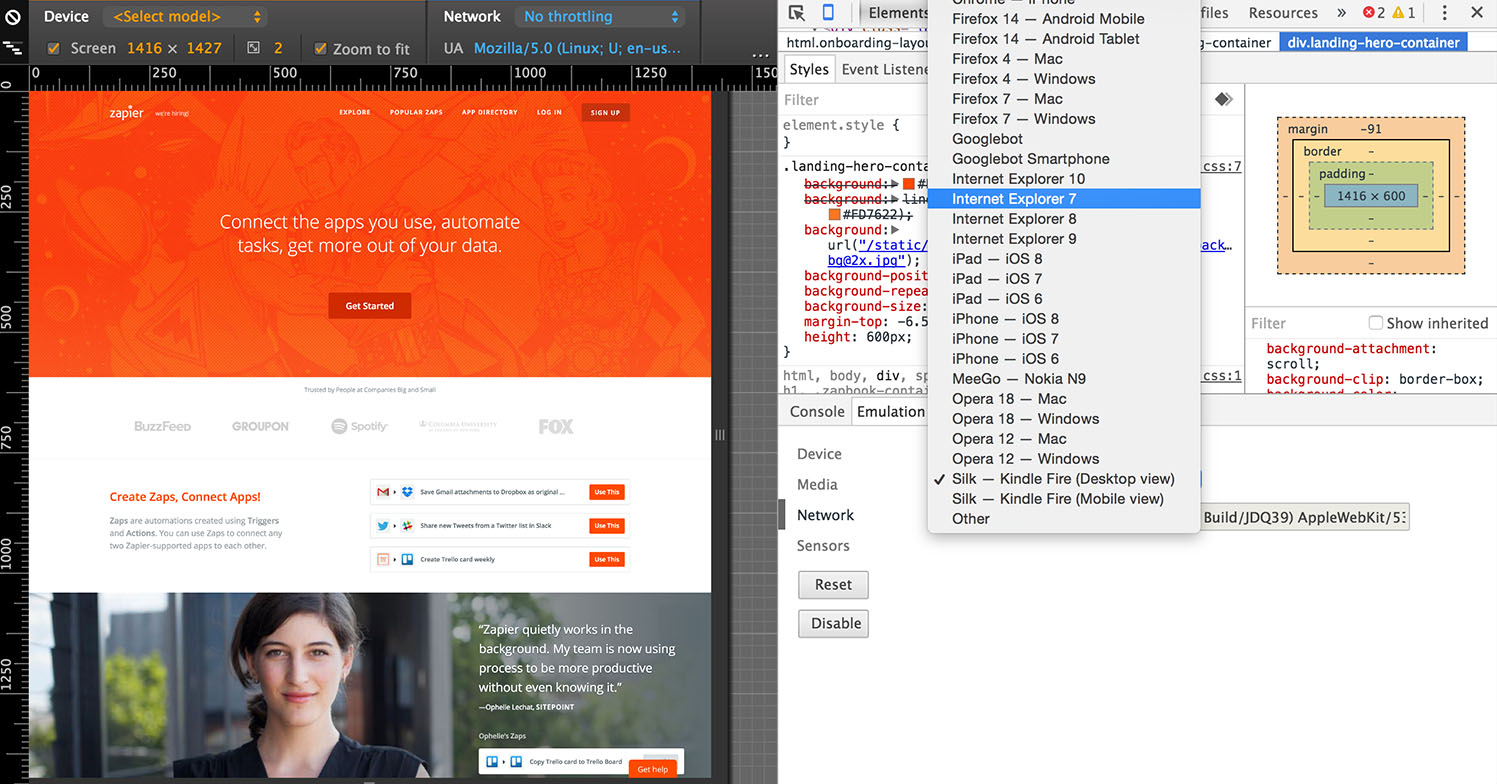
Network can show how your web pages will look on different browsers and on operating systems, such as Chrom browser on Android tablet, Safari browser on iPhone running iOS 8 .
For testing, you can set "Spoof user agent" in the Network section on the Emulation tab to "Internet Explorer 7" . Although there are not many changes, some websites will be designed differently to support the display of a better page interface on older browsers.
Also here you can see how long it takes to load the page when the speed of Internet connection is slow. From the Black Frame on the website, click the "No throttling" Menu under the Blue tab (blue tab), choose GPRS . Now proceed to reload the page and you will see the time to load the page when the Internet connection speed is slow and during the loading process, the page will look like.
- Device:
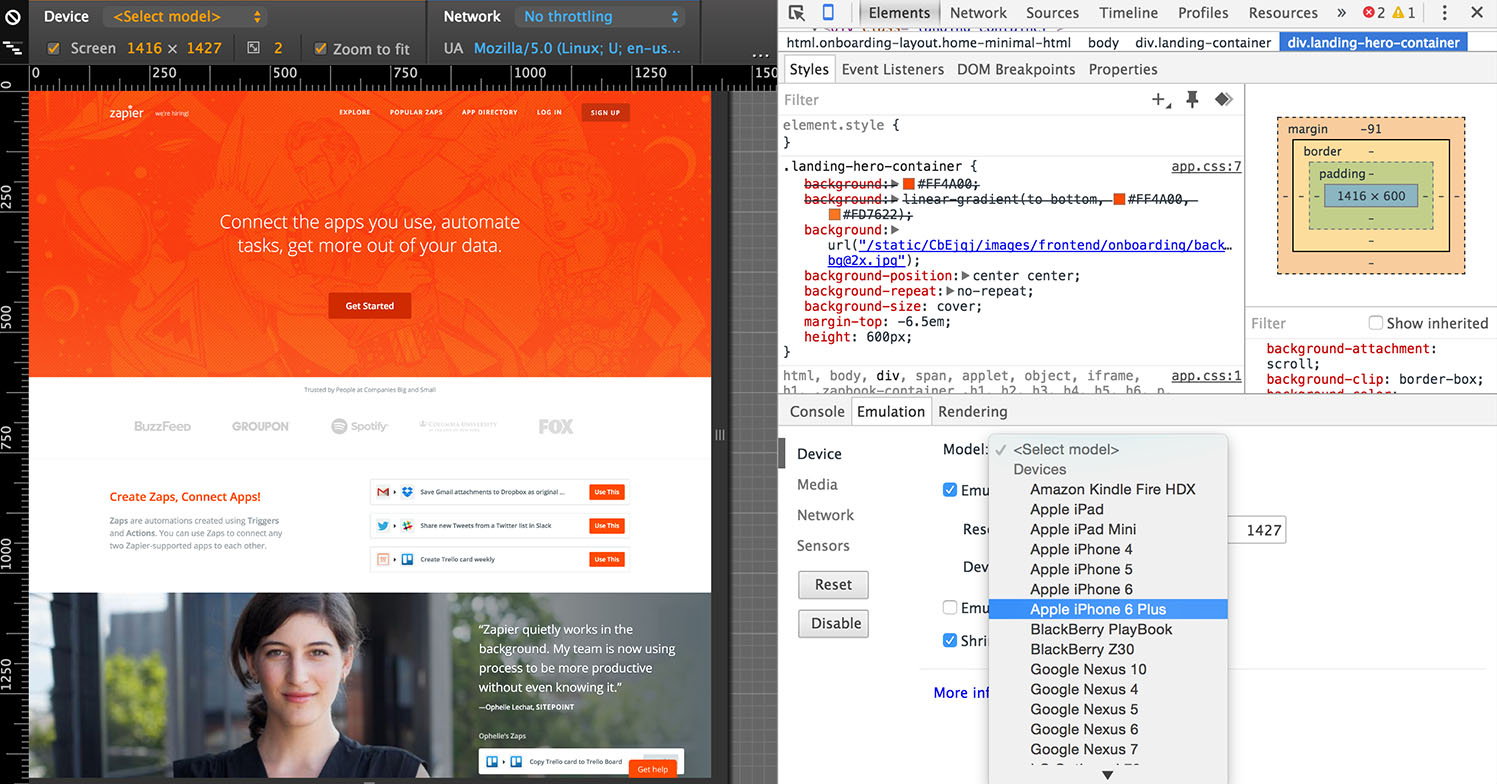
The Device emulator allows you to view the web page as if it were displayed on different communication devices, resolution and screen size. Combining browser settings at the Network tab is a good idea so you can view the page interface displayed on the device.
To proceed with the test, click the Device tab , then select Model from the Dropdown Menu. Now on the screen displaying the list of options, click "Apple iPhone 6 Plus" or the device you want.
The website interface will be "shrunk" just like the iPhone 6 Plus screen size, and you can zoom the screen up by clicking the "+" icon located in the top right corner.
On iPhone 6 Plus, the view is 1.8em, while the computer view is 2.7em.
"em" is a font size unit that allows you to automatically change the size of the font on the entire text.
- Sensors:
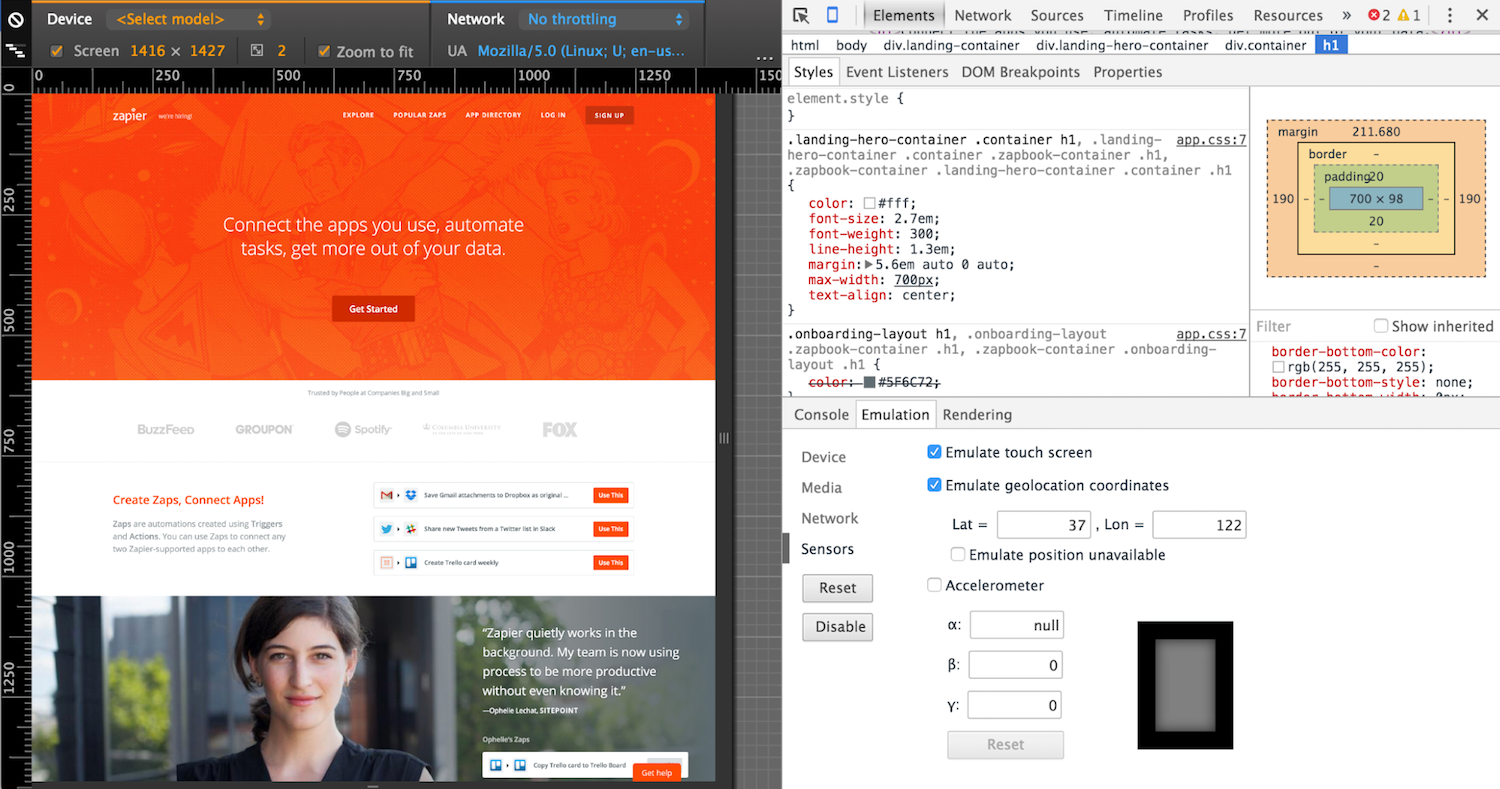
If you "" switch to the Sensors option on the Emulation tab, you can turn on or off the Touch Screen screen. Sensors are extremely useful in assisting to turn off the Touch Screen emulator if you want to mark a specific element on the site.
At the Sensors tab you can see how your site displays in different countries. Try viewing the website from Google headquarters in Mountain View, CA.
Select the checkbox next to the "Emulate geolocation coordinates" option , and enter the value 37 in the Lat = box and enter 122 in the Lon = frame and press Enter.
You will see nothing changes right?
This is because content on the page does not change based on your location. If you change the coordinates on the page, Groupon.com uses your location to display localized content, and you will get different results.
Visit Google.com in different locations and you'll see the Google logo in other countries or will display results in different languages.
Also on the Sensors tab, you also have options to edit accelerometer sensor settings.
Refer to some of the following articles:
- When the network speed is slow, turn this feature off to browse the Web on browsers faster
- To speed up Chrome browser, apply these tricks
- Fix Err-Connection-Refused and Err_Connection_Closed errors on Chrome browser
Wish you have moments of fun!


 Create a private Hotspot with DD-WRT
  How to align an Excel page so that when it fits on A4 page
  How to merge 2 pages into 1 page in Word
  How to Remove a Blank Page in Word
  How to delete vertical lines in Word
  How to create a Personal Wiki using Microsoft OneNote