How to insert Google Sheets charts into Google Docs
Inserting Google Sheets charts and Google Docs text content makes it easier for users to track content.
Table of Contents
Google Sheets also has full features to create data tables and draw diagrams similar to Excel. Users can also choose a variety of chart types to represent their data tables, such as pie charts, column diagrams, line charts, etc. Depending on usage needs and chart creation requirements which users choose the type of diagram they need. And after creating a chart on Google Sheets we can completely insert the chart into the content on Google Docs.
Although Google Docs also has the option of creating a column chart, a pie chart, but if you already have a Google Sheets chart, you will be able to insert it into Docs much faster, saving you the time to edit the content. Besides, the viewer is also more convenient to track the content on the same document page when the chart is available, without having to open additional Google Sheets files. The following article will guide you how to insert Google Sheets charts into Google Docs.
- Instructions on how to copy charts from Excel to Word
- How to create graphs, charts in Google Sheets
- Create Excel charts that automatically update data with these three simple steps
- How to link data between spreadsheets in Google Sheets
Instructions to insert Google Sheets into Google Docs
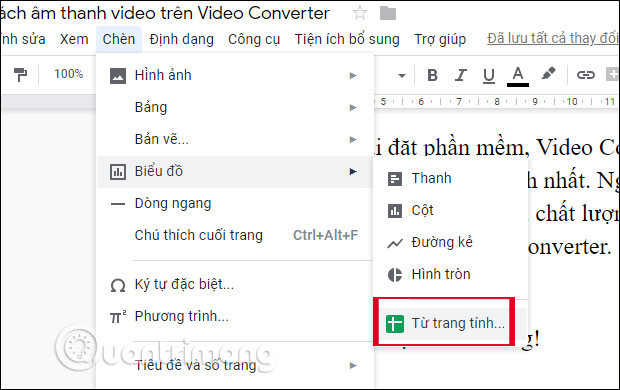
Step 1:
First of all, you need a spreadsheet file that has created a chart on Google Sheets. Then on the Google Docs interface click on the Insert item and then select the Chart section, select the section From the worksheet .
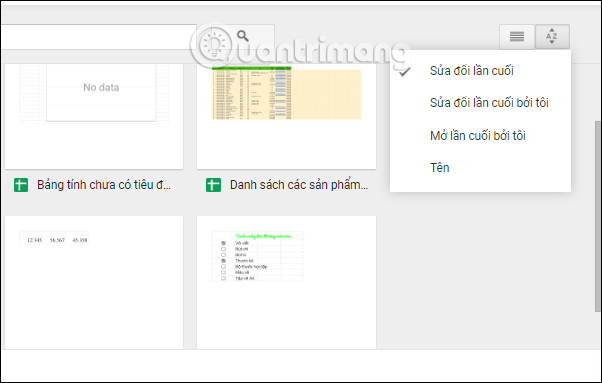
Step 2:
Soon we will see all the existing spreadsheets on the Google Sheets account. You can enter keywords into the search bar to find spreadsheets faster. Or you can choose to arrange data as shown below.
Click on the worksheet to find and click on the Select button below to proceed to insert content.

Step 3:
We will then see the graph displayed in the Google Docs interface. Below users should check the Link to Spreadsheet to update all changes in the data and charts in the Sheets file that users insert into the content. Click on the chart and select Enter to insert.

As a result, we will have the chart inserted into the content of Google Docs as shown below.

Step 4:
Clicking on the chart will have the option to immediately open the original document with the data sheet on Google Sheets. If users do not have the need to update the table content or data from Google Sheets to Google Docs, then select Unlink.

Instead of having to re-check the data on Google Sheets and then create the chart on Google Docs, then with the simple operations above we will have a quick chart in the document content. The chart will be updated with data, or even change other chart types when users change on Google Sheets file.
I wish you all success!
Was this article helpful?
Your feedback helps us improve.
Related Articles
 How to insert Google Sheets spreadsheets into Google Docs3 minutes read
 How to quickly insert a Google Sheets spreadsheet into Google Docs3 minutes read
 How to insert Google Sheets tables into Google Docs5 minutes read
 How to insert characters on Google Docs5 minutes read
 How to insert checkboxes on Google Sheets3 minutes read
 Tricks using Google Sheets should not be ignored7 minutes read
Reader Comments 0
Sign in with email or Google to join the discussion.