How to Create an Insectoid Pattern in Microsoft Excel
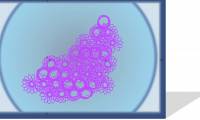
In this article, you'll learn to make the 'insectoid' pattern and image below, and the dozens of variations the file permits therefrom. Become familiar with the image to be created:
Table of Contents
Part 1 of 3:
The Tutorial
-
 Start a new workbook by saving the old workbook under a new name. Save the workbook into a logical file folder.
 -
 Complete all changes in the upper Defined Variables section.
- A3: "=1440/Rrs"
- A4: 1
- TURNS: 9
- S's Count: 6
- top: "=ROUND((-B4*PI())+(Adj),0)" (=968061)
- AAA: 1.00244189810508
- Divisor: -34,760,448,114.6
- YN: N
- Factor: "=IF(E4="Y",IF(ODD(S_COUNT)=S_COUNT,-S_COUNT*0.01,S_COUNT*0.01),-0.25)"
- New Variable: Select cell F2 and enter 2. Insert Name Define name Power to cell $F$2. Format Cell FIll Bright Turquoise Blue and Font Bold Black. Format Number Number Custom "Power " 0.0000 (with quote marks).
- H1: .92 (obtains result in Sync1 of 1.48859127)
- J1: .96 (obtains result in Sync2 of 2.513312629)
- all the rest calculate the same way or have the same value as before.
-
 Complete all changes in the lower Data columns section:
- A7:A1447: No change
- B7 amd B8:B1447: No change
- C7 and C8:C1447: No change
- D7:D1447: "=IF(COS((ROW()-7)*PI()/180*Factor)
- E7:E1447: "=IF(SIN((ROW()-7)*PI()/180*Factor)
- F7:F1447: Probably no change -- "=IF(A7=0,F6,((PI())*((SIN(B7/(C7*2))*GMLL*COS(B7)*GMLL*(COS(B7/(C7*2)))*GMLL)+D7)))"
- G7:G1447: Probably no change -- "=IF(A7=0,G6,((PI())*((SIN(B7/(C7*2))*GMLL*SIN(B7)*GMLL*(COS(B7/(C7*2)))*GMLL)+E7)))"
- H7:H1447: No change -- "=F7*GMLL*Sync1"
- I7:I1447: No change -- "=G7*GMLL*Sync1"
- J7:J1447 and K7:K1447 No change.
Part 2 of 3:
Explanatory Charts, Diagrams, Photos
- (dependent upon the tutorial data above)
-
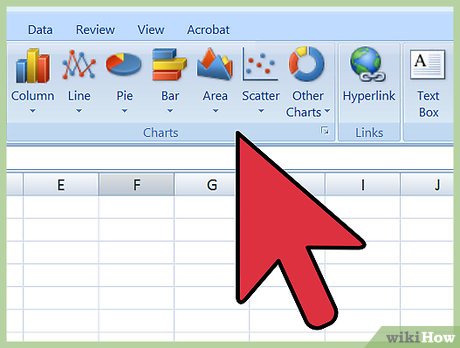 Create the chart.
- Select F7:G1446 and, using Chart Wizard or the Ribbon, select Charts, All/Other, Scatter Smoothed Line Scatter. Copy or cut the small chart atop the data and activate the Chart worksheet and paste into cell A1. Hover over lower right corner until the cursor changes to a double arrowhead and then pull the sheet into an expanded version to about G54.
- Using Chart Layout, get rid of both axes and both vertical and horizontal grid lines and the legend.
- Set Line Weight to 1, Dark Blue.Smoothed Line.
- Set Shadow to cobalt blue or Prussian blue (I forget its name), Style Outer, Size 91%, Blur 5.5, Distance 48 point, Transparency 17% per Current Selection Series1 and Format Selection of Chart Layout.
- Set Current Selection to Chart Area and Format Selection Line to No Line., Fill to No Fill, OK.
- Set Current Selection to Plot Area and Format Selection to Solid Fill White Transparency 0%, Line to No Line, Shadow to Checked Outer Black, Size 74%, Blur 69.5 Pt., Distance 100 pt., and Transparency 77%; Glow - No Glow; 3-D Format to Bevel Top Cool Slant Width 13 pt and Height 6 pt, Bottom None; Depth & Surface - Material = Clear, Lighting blank, Angle = 0 degrees, OK. Done!
-
 Activate the Data worksheet and copy A1:J6 -- the "live" formulas -- and then activate the Saves worksheet and paste the live formulas in. Then activate the Data sheet and with the Shift Key depressed, do Copy Picture of A1:J8 and activate the Saves worksheet and do shift key + Paste Picture, or just do Copy and paste special formats, then values. The first way is easier a little because of the long note overflowing the column widths. Then activate the Chart worksheet and do shift key + Copy and Paste Picture into the Saves worksheet under the saved data. The reason for pasting the values also is because when formulas get pasted below this picture, they do not have the same references as when pasted at the top, so the results are different than on the the Data worksheet. But formulas still need to be preserved that have been altered, else it would be quite difficult to reconstruct images like this one years later.
 -

-

Part 3 of 3:
Helpful Guidance
- Make use of helper articles when proceeding through this tutorial
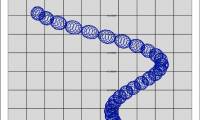
- See the article How to Create a Spirallic Spin Particle Path or Necklace Form or Spherical Border for a list of articles related to Excel, Geometric and/or Trigonometric Art, Charting/Diagramming and Algebraic Formulation.
- For more art charts and graphs, you might also want to click on Category:Microsoft Excel Imagery, Category:Mathematics, Category:Spreadsheets or Category:Graphics to view many Excel worksheets and charts where Trigonometry, Geometry and Calculus have been turned into Art, or simply click on the category as appears in the upper right white portion of this page, or at the bottom left of the page.
Was this article helpful?
Your feedback helps us improve.
Related Articles
 How to Create a Floral Glassware Pattern in Microsoft Excel1 minutes read
 How to Create a Flower Pattern in Microsoft Excel7 minutes read
 How to Create an Equilateral Springs Pattern in Microsoft Excel4 minutes read
 How to Create a Tornado Screw Pattern in Microsoft Excel2 minutes read
 How to Create the One Sphere Pattern in Microsoft Excel4 minutes read
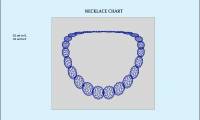 How to Create a Necklace Pattern in Microsoft Excel8 minutes read
Reader Comments 0
Sign in with email or Google to join the discussion.