How to Create a Sin and Cos Circle in Excel
Learn how to create a a graph of a circle using the sin (sine) and cos (cosine) functions in Microsoft Excel in this article. Additionally, you will learn to offset the circle, plot a radius and to shrink or expand the circle and radius...
Table of Contents
Part 1 of 3:
The Tutorial
-
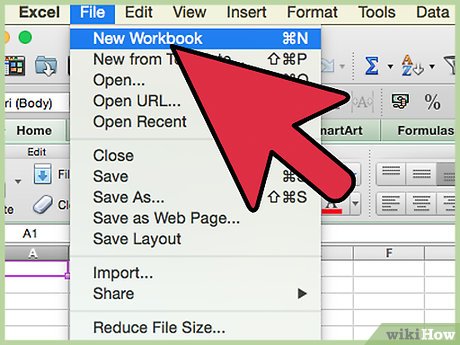 Open a new XL workbook from the desktop.
- Click on the green X icon on the Dock to make Excel the active application.
- Put on the dock with the yellow dot at top left of the window of any XL workbooks automatically opened.
- Do File New Workbook from the Excel Menu.
- Save the workbook as Circle, or other similar filename, into a logical file folder (if you follow all Xhohx and Christopher G. articles, this is #110, and you may want to create a special folder with an apt name reminiscent of the article name for the folder, beginning with 110 -- in that case, the filename = the article name)(100 for Xhohx, and this is #10 for Christopher G.). That way, you can go into Advanced Editing and make a copy of the text of the entire article for safekeeping by pasting it into Word, under the bolded and linked title.
-
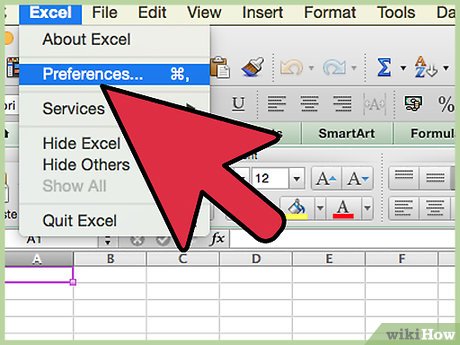 Set the Preferences under the Excel menu:
- In General, set R1C1 to Off and select Show the 10 Most Recent Documents .
- In Edit, set all the first options to checked except Automatically Convert Date System . Set Display number of decimal places to blank (as integers are preferred). Preserve the display of dates and set 30 for 21st century cutoff.
- In View, click on show Formula Bar and Status Bar and hover for comments of all Objects . Check Show grid lines and set all boxes below that to auto or checked.
- In Chart, allow show chart names and set data markers on hover and leave the rest unchecked for now.
- In Calculation, make sure Automatically is checked and calculate before save is also checked. Set max change to .001 as goal-seeking is not done in this project. Check save external link values and use 1904 system
- In Error checking, check all the options.
- In Save, select save preview picture with new files and Save Autorecover after 5 minutes
- In Ribbon, keep all of them checked except Hide group titles and Developer .
-
 Go to cell A2 and do Freeze Panes under the Window menu.
- It helps by placing the cursor between the A of Column A and the 1 in Row 1 in the upper leftmost corner and selecting the entire worksheet.
- Format Cells Number Number Custom +0.0000;-0.0000;=0.0000, Font Size 9 to 12.
- Do Format Cells Alignment Text Alignment Horizontal Center.
-
 Input column title labels, defined variable names and variable values in Row 1, and columns E and F:
- Enter the label Cos into cell A1;
- Enter the label Sin into cell B1;
- Enter the label Radius x into cell C1;
- Enter the label Radius y into cell D1;
- Enter the defined variable name ShrinkExpand into cell E1 and adjust column size to fit;
- Enter the defined variable name X Offset into cell E2;
- Enter the defined variable name Y Offset into cell E3;
- Select range E1:F3 and do Insert Names Create in Right Column;
- Enter 2 into cell F1 and enter 2 into cell F2 and enter 2 into cell F3.
- Select cell range F1:F3 and do Format Cells Font Red, Fill Yellow, since they're input cells.
-
 Enter the formulas for the "3 o'clock" Radius line to appear in the Chart:
- Enter to cell C2 the formula, without quotes, "=X_Offset"
- Enter to cell D2 the formula, without quotes, "=Y_Offset"
- Enter to cell C3 the formula, without quotes, "=C2+ShrinkExpand"
- Enter to cell D3 the formula, without quotes, "=D2"
-
 Enter the Cosine (x) and Sine (y) formulas and fill down:
- Enter to cell A2 the formula, w/o quotes, "=X_Offset+COS((ROW()-2)*PI()/180)*ShrinkExpand"
- Enter to cell B2 the formula, w.o quotes, "=Y_Offset+SIN((ROW()-2)*PI()/180)*ShrinkExpand"
- Edit Go To cell range A2:B362
- Do Edit Fill Down
Part 2 of 3:
Explanatory Charts, Diagrams, Photos
-
 Create the Chart:
- With cell range A2:B362 still selected, do either Insert Chart or Select Charts from the Ribbon;
- Select chart type Scatter, Smooth Line Scatter; a chart should appear on your worksheet.
- Name the worksheet, Circle Data and Chart;
- Enter to cell D4 the note 'edited chart series' and make it italic and aligned right;
- Select cell range C2:D3, do command and c for copy, click inside the circle in the chart and do command and v, paste. This may come out wrong. Click on the line created and edit the Series Formula in the formula bar until it exactly reads as follows (but w/o quotes):
- "=SERIES("Radius",'Circle Data and Chart'!$C$2:$C$3,'Circle Data and Chart'!$D$2:$D$3,2)"
- Click on the Circle. Its Series Formula should exactly read as follows -- you'll probably have to edit in "Circumference":
- "=SERIES("Circumference",'Circle Data and Chart'!$A$2:$A$362,'Circle Data and Chart'!$B$2:$B$362,1)"
- Check that your chart looks like the one pictured here.
- That's it! You're finished!
-
 Further formatting of the chart (optional):
- By double-clicking on the Circumference or the Radius, you'll bring up the Format Data Series dialog box, which gives you many options as to the appearance of your final image -- try out different options -- have fun with it!!
- You can also tap with the mouse near the outside of the chart, beyond the plotting area, and hold down the Shift Key, and do Edit Copy Picture. Then there are various menu tool formatting options additionally available to you. You would do Shift Key and Paste Picture to a new worksheet called SAVES, or CHARTS, or VIEWS, or something similar.

Part 3 of 3:
Helpful Guidance
- Make use of helper articles when proceeding through this tutorial:
- See the article How to Create a Spirallic Spin Particle Path or Necklace Form or Spherical Border for a list of articles related to Excel, Geometric and/or Trigonometric Art, Charting/Diagramming and Algebraic Formulation.
- For more art charts and graphs, you might also want to click on Category:Microsoft Excel Imagery, Category:Mathematics, Category:Spreadsheets or Category:Graphics to view many Excel worksheets and charts where Trigonometry, Geometry and Calculus have been turned into Art, or simply click on that category if it appears in the upper right white portion of this page, or at the bottom left of the page.
Was this article helpful?
Your feedback helps us improve.
Related Articles
 How to circle answers in Word, Excel, PowerPoint4 minutes read
 How to Draw a Circle in Gimp7 minutes read
 Macromedia Flash - Variable circle3 minutes read
 How to use Circle K's CK Club app2 minutes read
 How to crop an image into a circle in Photoshop3 minutes read
 How to create a yellow circle around the mouse cursor on Windows5 minutes read
Reader Comments 0
Sign in with email or Google to join the discussion.