SMALL function - The function returns the kth smallest value in a dataset in Excel
SMALL function: The function returns the kth smallest value in a dataset. Syntax: SMALL (array, k)
The following article introduces you to the SMALL function - one of the functions in the statistical function group is very popular in Excel.

Description: The function returns the kth smallest value in a dataset.
Syntax: SMALL (array, k)
Inside:
- array : The array or range of data points you want to determine the kth smallest value.
- k: The order (from the smallest value) in the data array to be returned.
Attention:
- If array is empty -> the function returns the #NUM! Error value .
- If k ≤ 0 or k exceeds the number of data points in the array -> the function returns the #NUM! Error value
- where n is the number of data points we have:
+ SMALL (array, 1) -> returns the smallest value in the array.
+ SMALL (array, n) -> returns the largest value in the array.
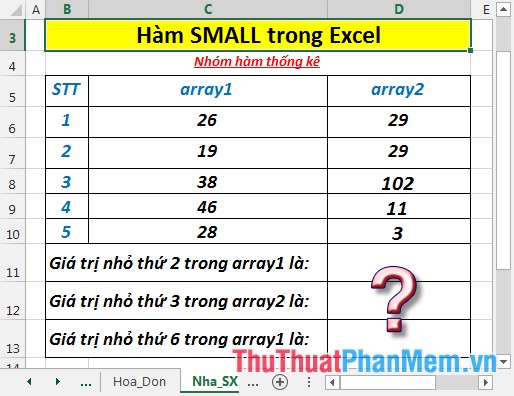
For example:
Calculate the kth smallest value as described in the following data table:
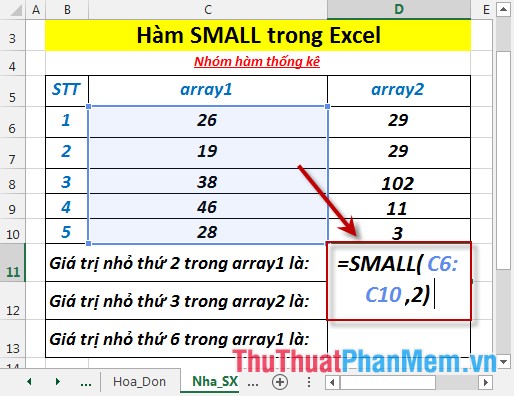
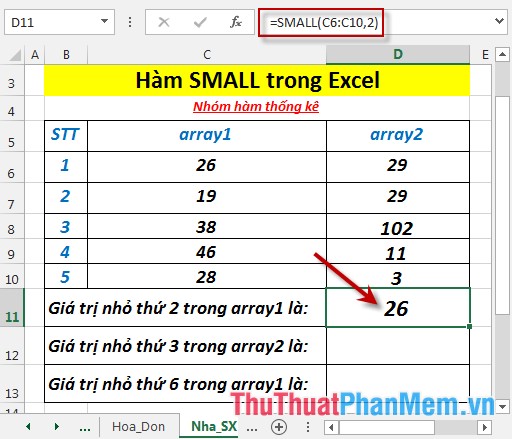
- Calculate the second smallest value in array1. In a cell to calculate enter the formula : = SMALL (C6: C10,2)
- Press Enter -> the second smallest value in array1 is:
- Calculate the 3rd smallest value in array2. In a cell to calculate enter the formula: = SMALL (D6: D10,3)
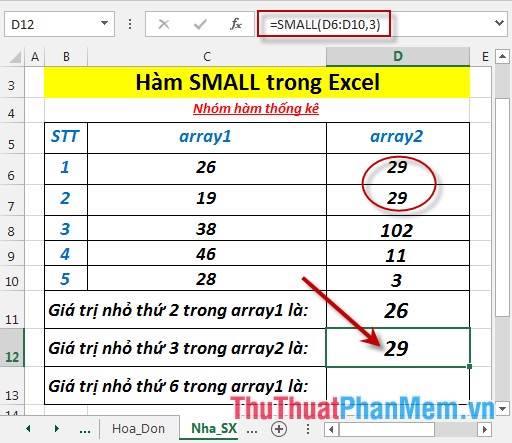
In array2, there are 2 similar elements are 29 but the function is still arranged in 2 orders, 1 value is the 3rd and the value is 4th.
- Calculate the 6th smallest value in array1. In a cell to calculate enter the formula: = SMALL (C6: C10,6)
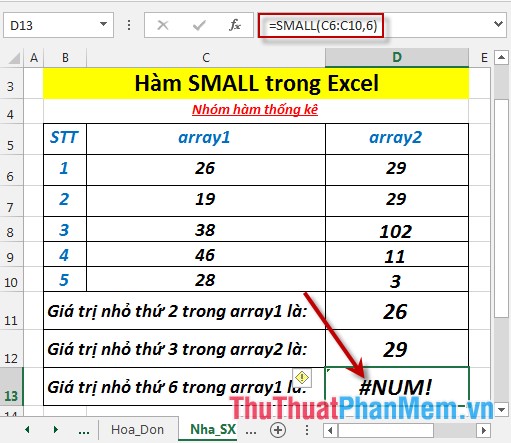
Because array1 has only 5 elements, there is no 6th value -> the function returns the #NUM! Error value .
Above are instructions and some specific examples when using the SMALL function in Excel.
Good luck!
Was this article helpful?
Your feedback helps us improve.
Related Articles
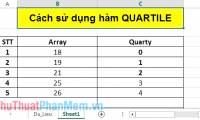 QUARTILE function - The function returns the quartile of a dataset in Excel3 minutes read
 LARGE function - The function returns the kth largest value in a dataset in Excel3 minutes read
 QUARTILE.EXC function - The function returns the quartile of a dataset without values 0 and 1 in Excel2 minutes read
 KURT function - The function returns the sharp coefficient of a dataset in Excel3 minutes read
 TRIMMEAN function - The function returns the average of the inner part of a dataset in Excel2 minutes read
 QUARTILE.INC function - The function returns the quartile of a dataset including values 0 and 1 in Excel3 minutes read
Reader Comments 0
Sign in with email or Google to join the discussion.