QUARTILE.INC function - The function returns the quartile of a dataset including values 0 and 1 in Excel
QUARTILE.INC function: The function returns the quartile of a data set, with percentile values from 0 to 1 including 0 and 1. Support functions from Execl 2010 onwards. Syntax: QUARTILE.INC (array, quart)
The following article introduces you to the QUARTILE.INC function - one of the functions in the group of statistical functions that is very popular in Excel.

Description: The function returns the quartile of a dataset, with percentile values from 0 to 1 including 0 and 1. Functions supported from Execl 2010 onwards.
Syntax: QUARTILE.INC (array, quart)
Inside:
- array: An array or range containing values that want to find quartiles, a required parameter .
- quart: The position of the quartile to be returned, is the required parameter including the following values:
+ quart = 0 -> function returns the minimum value.
+ quart = 1 -> function returns the first quartile (25th percentile).
+ quart = 2 -> function returns the median value (50th percentile).
+ quart = 3 -> function returns the 3rd quartile (75th percentile).
+ quart = 4 -> function returns the maximum value.
Attention:
- If quart is not an integer -> it is truncated to an integer.
- If array is empty -> the function returns the #NUM! Error value .
- If quart > 4 or quart <0 -> the function returns the #NUM! Error value
- The MIN and MAX, MEDIAN functions return the same value as the QUARTILE.INC function with corresponding values quart = 0, quart = 4, quart = 2.
For example:
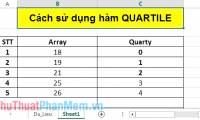
Locate the units as described in the following data table:

- Determine the position of the 1st percentile. In the cell to calculate enter the formula : = QUARTILE.INC (D6: J6, D7)

- Press Enter -> 1st percentile is:

- The fourth percentile. In the cell to calculate enter the formula: = QUARTILE.INC (D6: J6, D8). Press Enter -> return value is:

- In case the value of quart = 0 -> the function still calculates normally.

- Where the quart value = 6> 4 -> the function returns the #NUM! Error value

Above are instructions and some specific examples when using QUARTILE.INC function in Excel.
Good luck!
Was this article helpful?
Your feedback helps us improve.
Related Articles
 QUARTILE.EXC function - The function returns the quartile of a dataset without values 0 and 1 in Excel2 minutes read
 QUARTILE function - The function returns the quartile of a dataset in Excel3 minutes read
 LARGE function - The function returns the kth largest value in a dataset in Excel3 minutes read
 KURT function - The function returns the sharp coefficient of a dataset in Excel3 minutes read
Reader Comments 0
Sign in with email or Google to join the discussion.