DMIN () function (returns the minimum value by condition) in Excel
DMIN () function helps you find and return the smallest value in a column in a list or database that meets the conditions that you give.
Table of Contents
The MIN () function helps you return the smallest value of values, the DMIN () function will return the smallest value according to the conditions you specify. When you need to get the minimum value under a certain condition, you should use the DMIN () function. If you do not know the syntax and usage of the DMIN () function, follow the following article.
The article describes the syntax and usage of the DMIN () function in Excel.
Description
DMIN () function helps you find and return the smallest value in a column in a list or database that meets the conditions that you give.
Syntax
= DMIN (database, field, criteria)
Inside:
- database: list or related database including column headers.
- field: the field (column) needs to get the maximum value. You can enter the column header directly in quotation marks or some representing the column position in the database: 1 for the first column, 2 for the second column, etc., you can also enter the cell containing the required column header. Using example B3, C1 .
- criteria: is the range of cells that contain conditions, you can choose any as long as the range contains at least one column header and the cell below the column header contains conditions for the column.
Note
- You should set the criteria range on the worksheet so that when adding data, the range of conditions does not change.
- The scope of the conditions that need to be separated is not inserted into the list or database to be processed.
- Criteria must contain at least column headers and a cell containing conditions under column headers.
For example
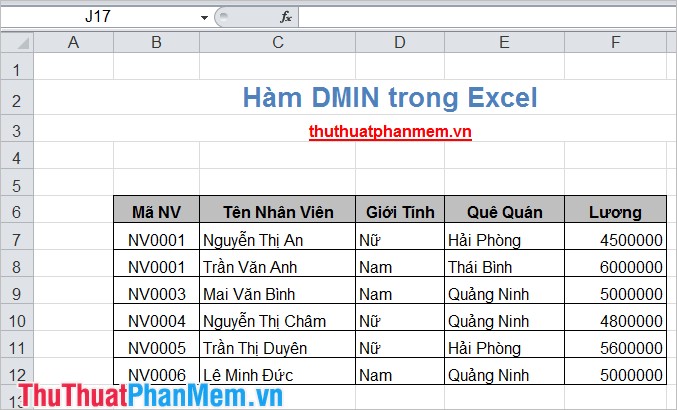
Find the lowest salary of the employees who have a Hometown in Quang Ninh in the following data table:
You need to create a range of criteria criteria that is Que Quan and Quang Ninh.
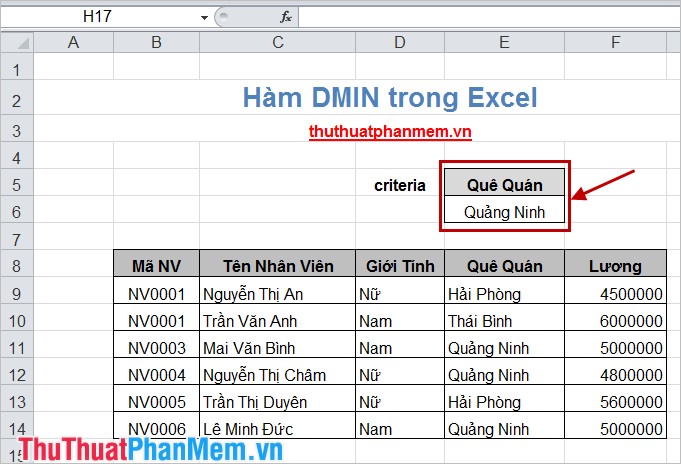
Apply the DMIN () function formula: = DMIN (B8: F14, F8, E5: E6)
B8: F14 is a list, a database area.
F8 is the Salary column to find the minimum value.
E5: E6 is the criteria range just created.
You will then get the following result:

The syntax and usage of the DMIN () function is very simple, you just need to apply it to the appropriate requirements. The function will help you a lot in statistics of data in Excel. Good luck!
Was this article helpful?
Your feedback helps us improve.
Related Articles
 How to use the IF function in Excel1 minutes read
 AVERAGEIF function (returns the average value according to the condition) in Excel3 minutes read
 How to use the IFS function in Excel 20165 minutes read
 How to use MAXIFS function in Excel 20164 minutes read
 DMAX () function (returns conditional maximum value) in Excel3 minutes read
 AVERAGEIF function - The function returns the average of the arguments with the conditions specified in Excel3 minutes read
Reader Comments 0
Sign in with email or Google to join the discussion.