T.DIST - The function returns the Student t-distribution on the left in Excel
T.DIST: The function returns the Student's t-distribution on the left. Functions used in testing the hypothesis of small numbers of data sets. Support functions from Excel 2010 onwards. Syntax: T.DIST (x, deg_freedom, cumulative)
The following article introduces you to the T.DIST function - one of the functions in the statistical function group is very popular in Excel.

Description: The function returns the Student's t-distribution on the left. Functions used in testing the hypothesis of small numbers of data sets. Support functions from Excel 2010 onwards.
Syntax: T.DIST (x, deg_freedom, cumulative)
Inside:
- x: Value used to evaluate the distribution, is a required parameter.
- deg_freedom: Number of degrees of freedom of the distribution, is a required parameter.
- cumulative: A logical value that determines the form of the function, which is a required parameter, including:
+ cumulative = True -> returns the cumulative distribution function.
+ cumulative = False -> returns the probability density function.
Attention:
- Any argument that is not a number -> the function returns the #VALUE! Error value
- If deg_freedom <1 -> the function returns an error value.
- The minimum value of deg_freedom must be equal to 1.
For example:
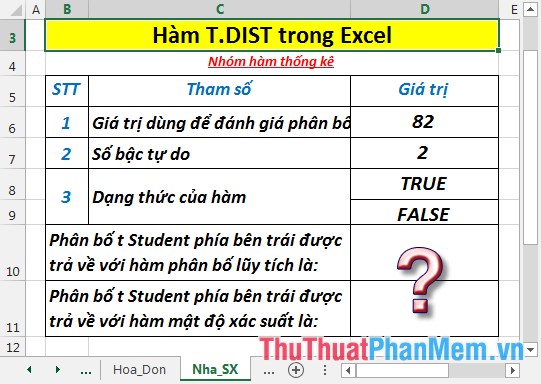
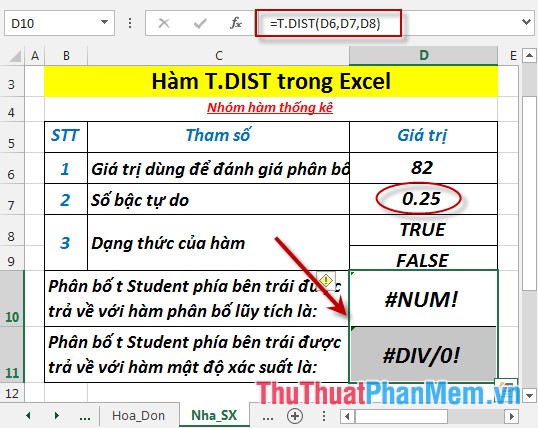
Calculate the Student's t-distribution on the left as described in the following data table:
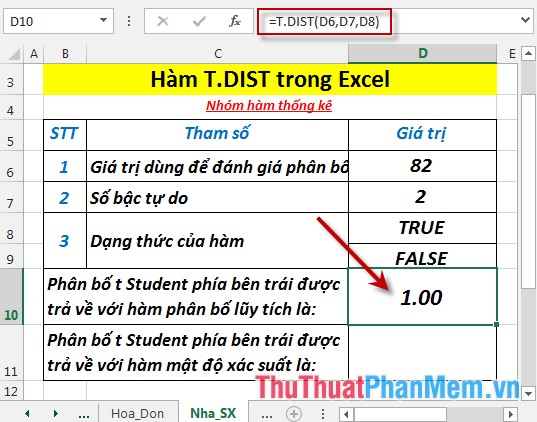
- Calculates the Student's t-distribution on the left is returned with the cumulative distribution function. In a cell to calculate, enter the formula : = T.DIST (D6, D7, D8)

- Press Enter -> Student's left t-distribution is returned with the cumulative distribution function is:
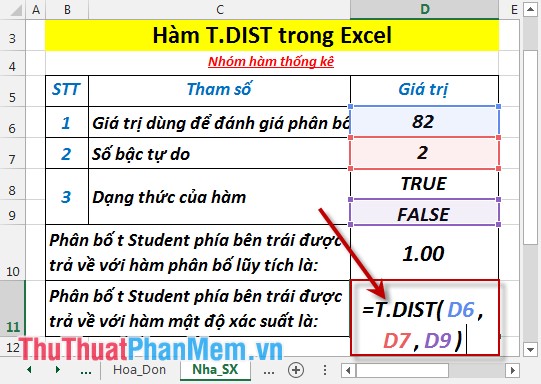
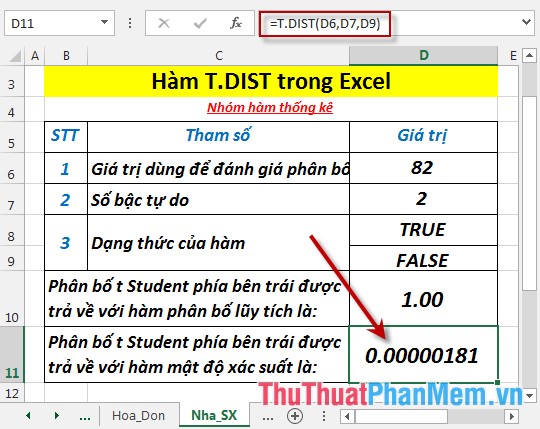
- Calculate the Student's t-distribution on the left is returned with probability density function. In a cell to calculate, enter the formula : = T.DIST (D6, D7, D9)
- Press Enter -> Student's left t-distribution is returned with the probability density function is:
- If the number of degrees of freedom is less than 1 -> the function returns the error value:
Above are instructions and some specific examples when using T.DIST function in Excel.
Good luck!
Was this article helpful?
Your feedback helps us improve.
Related Articles
 TDIST function - The function returns the probability of the Student distribution in Excel4 minutes read
 T.INV function - The function returns the inverse value of the Student t distribution in Excel2 minutes read
 T.DIST.RT - The function returns the Student's t-distribution on the right in Excel2 minutes read
 T.DIST.2T - The function returns the two-tailed Student distribution in Excel2 minutes read
 T.INV.2T - The function returns the two-sided inverse of the Student's t-distribution in Excel3 minutes read
 CONFIDENCE.T function - The function returns the confidence interval of the population by using the Student's t-distribution in Excel2 minutes read
Reader Comments 0
Sign in with email or Google to join the discussion.