MS Access - Lesson 13: Creating Reports (report)
Reports (reports) are a way to view and analyze a large amount of data. You can use the Report Wizard or create an arbitrary report that you need..
TipsMake.com - Reports (reports) is a way to view and analyze a large amount of data. You can use the Report Wizard or create an arbitrary report that you need.
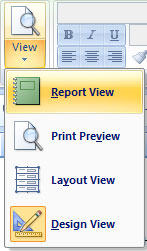
Report Views
Reports can be displayed in the following four modes: Design View Mode Design View provides you with the structure of the report. You can add, edit or delete report elements. But you cannot manipulate data in multiple tables associated with the report. The Report View Report View allows you to view data from the table but does not change the layout of the report. Layout View This mode allows you to view data from the table and can add, edit, and delete components of the report. Print Preview Print Preview lets you see what the report will look like when printed.
To change report view:
- Click the View button on the Home tab
 Create a Report
To create a white report:
- Click the Blank Report button on the Create tab
 - Click the Add Existing Fields button
- From the list of schools, click and drag the fields to the report

Report Wizard
To create a report using the Report Wizard:
- On the Create tab, click the Report Wizard button
 - Choose the Tables / Queries you want to have on the report
- Select the fields you want to give the report and then press the> button (if you select each field) or press the >> button (if you select all schools).
- Click Next
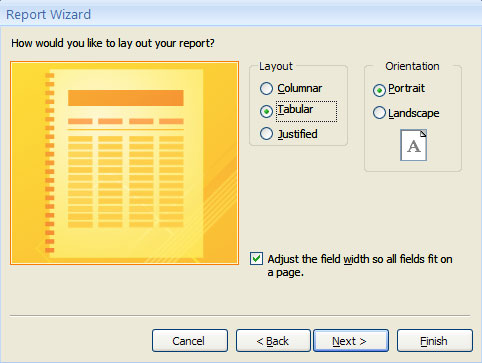
 - Choose to arrange for the report
- Click Next

- Select the layout ( Layout ) and the horizontal or vertical orientation ( Orientation ) for the report
- Then click Next
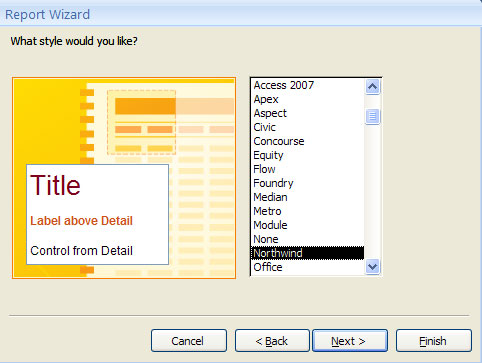
- Select the type for the report
- Click Next
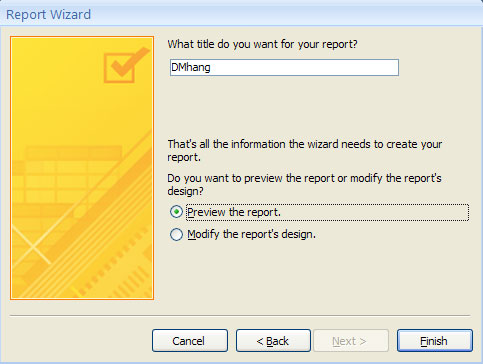
 - Create a title for the report
- Choose how you want to open the report ( Preview the report ) or edit the report ( Modify the report's design )
- Click Finish
 Calculation field
You can create reports including the calculation field. These reports will display the information you want with an arithmetic operation. To add a calculation field to the report:
- Open the Report you want to create additional calculation fields
- Click the View button
- Click Design View
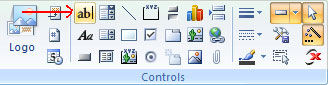
- Click the Design tab
- Click the Text Box button
 - Click on the section on the report where you want to locate the textbox
- Click the Property Sheet button
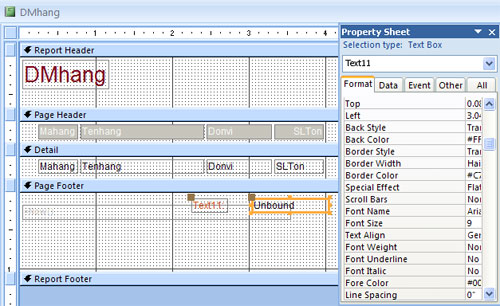 - Click the Data tab
- Click on the button on the right of Control Source with three dots
 - Insert the fields you want to have in the calculation
- Click OK.
