Learn about the management and monitoring functions of Resource Monitor tool
In the following article, we will show you some of the features and usage of the handy Resource Monitor tool from Microsoft, which is used to manage and monitor the operation of the network system. storage capacity and system performance ...
TipsMake.com - In the following article, we will introduce you some of the features and how to use the handy Resource Monitor tool from Microsoft, used to manage and monitor system activity. network, storage capacity and system performance.
1. Monitoring the operation of the network system:
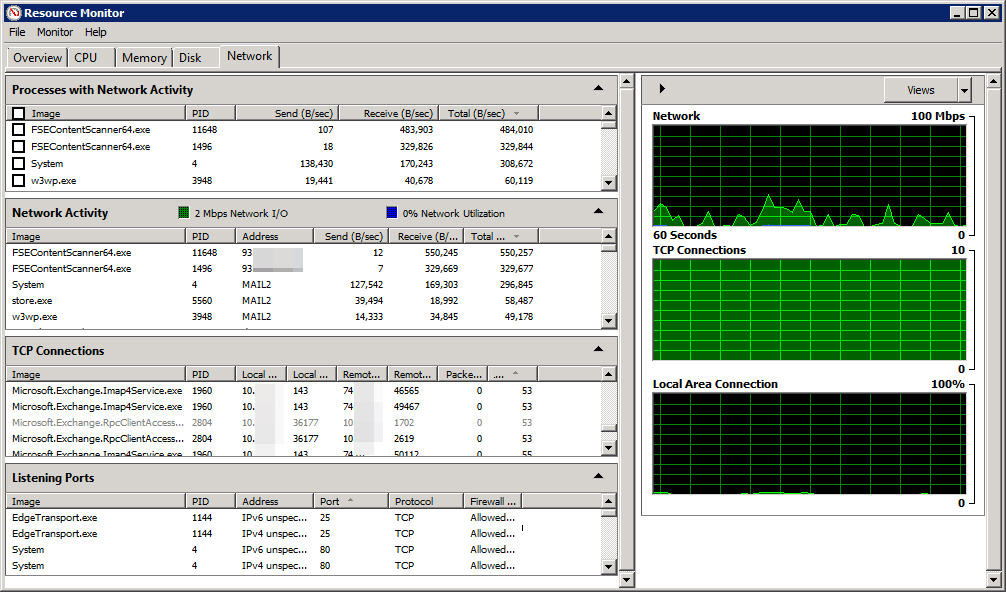
The screenshot above is taken from the Resource Monitor application from a computer that installs the Windows Server 2008 R2 operating system with Exchange Server 2010 and all installed Exchange roles. As such, we can easily realize that the server has a significant need for network resources to meet performance in the scope of work. We can easily realize that the most occupied area here is the statistics section, the right windows correspond to the graphs, clearly described with each specific metric.
Processes With Network Activity:
Here, Resource Monitor will display a list of all active processes and using system resources, specifically we will see the exact name and number of programs.
- Image : file name of the executing process.
- PID : corresponding ID number associated with the program, this feature is quite useful when users want to manage or monitor a certain process.
- Send (B / sec): Average data in bytes units that the program sends from the network every second.
- Receive (B / sec): Average data in bytes units that the program receives from the network every second.
- Total (B / sec) : the total amount of average data in bytes units that the program generates during the entire operation time.
However, the information given here is not really useful to solve complex problems in the system, except for those programs that are using less or more resources. With the screenshot above, we can see that the FSEContentScanner64.exe application is requesting a lot of resource data from the system.
Network Activity:
In this section, the program will provide some more useful information for users:
- Network I / O : the total amount of data being used in Mbps.
- Network Utilization : all data of the system will be displayed through a single component, thereby helping users to easily monitor these parameters. If this number regularly reaches 100%, you are having problems, and the only solution is to increase the bandwidth traffic.
- Address : this is the name or IP address of the program, the application is working.
TCP Connections:
- Local Address : many server systems are equipped with more than 1 network card, and each network card can be assigned with multiple IP addresses. To determine exactly which IP address or network card is causing the main cause of the system, this is the part you should pay close attention to because many detailed and specific information are listed here.
- Local Port : similar to the above, your system may be using multiple services enabled on different ports - Ports. And this is where the problem between networks and ports is determined.
- Remote Address : each connection via local system requires the ability to communicate with a certain system that is being remotely controlled. In this section, we will see that all remote computer addresses account for more than half of the data stream.
- Remote Port: here we will find remote ports to complete the communication process between systems.
- Packet Loss (%): these are very important numbers, the bigger the number - the greater the loss of network traffic means that the quality of the network is in a bad condition.
- Latency (ms): often referred to as latency, understand is the time required to transfer data from point A to point B. This number is larger, meaning the longer the time period and vice versa . Some programs, online applications or media transfers often cause this phenomenon.
Listening Ports:
- Address : certain programs and services are often associated with an IP address whether it is IPv4 or IPv6 . If the service is not fixed with a static IP address, this column will display as unspecified.
- Protocol : a protocol that uses TCP (Transmission Control Protocol) or UDP (User Datagram Protocol) . In particular, the implementation process via TCP will be guaranteed in terms of data, while UDP is not.
- Firewall Status : If your Firewall feature is blocking some programs through the amount of traffic, then we know more specific information through this section.
The graphs:
The Network chart will show all the bandwidth usage within the last 60 seconds for all programs. More specifically, TCP Connections components indicate how many new TCP connections have been established, and if this number is too high, it means your system is having problems, can't be controlled. Yes, intruded by spyware . The Local Area Connection chart shows all the data being used, displayed in%.
2. Monitoring data storage performance:
In the next part of the article, we will learn about how the data storage function works - Disk of the Resource Monitor tool .

Processes With Disk Activity:
This part of the program will display a list of all active applications and use the storage on the hard drive partition, namely the name of the active program and specific statistics.
- Image : name of programs and processes in progress.
- PID : ID number corresponding to active processes.
- Read (B / sec) : the average amount of data calculated in bytes per second read by the program.
- Write (B / sec): the average amount of data calculated in bytes per second recorded by the program.
- Total (B / sec) : the average amount of data calculated in bytes per second accessed by the program.
But technically, the information provided here is not really useful, because we can only see the basic details of the applications and programs that are accessing data on the drive. hard. Specifically in the screenshot above, we can easily realize that the process named DPMRA.exe is reading a lot of data from the storage partition.
Disk Activity:
In the next section, the program will provide users with more useful information in identifying and solving problems in the system. Specifically, in the right window, we will see two boxes showing details of the read and write data, along with the corresponding duration of the program.
- File : The name of the file used by the program is in active status, and also indicates the full path.
- I / O Priority: priority and data transfer via I / O method.
- Response Time (ms): the response time from the hard drive partition calculated by milisecond. Specifically, if this number is smaller, the better, and any application with this interval is less than 10 ms, it means that it is in a stable operating state, and if it is greater than 20 ms then the You need to pay attention to those applications. When this parameter is 50 ms or larger, we are having a really serious problem.
Storage:
- Logical Disk: the character of the partition attached to the hard drive.
- Physical disk: Which hard drive is being managed at this information line.
- Active Time (%): the ratio of time to partition the hard drive operating in different states and modes. For example, if a hard drive is constantly operating with very high performance (80% or higher), then you are likely to experience 'bottleneck' related to data, but if the number is This is close to 100%, then surely we will need to add more storage drives.
- Available Space (MB): Available space to store the remaining data on the hard drive partition.
- Total Space (MB): total storage capacity of the partition.
- Disk Queue Length: The parameters here indicate the number of requests (read and write data) that have not been resolved at any time. If this parameter is quite high, the reason may be because there is not enough storage space on the partition to meet the needs of services and programs on the system.
The graphs:
This tool is really useful in specifying the system's data transfer rate. The green section shows the current amount of I / O data, while the blue section shows the active time period with the highest performance of the hard drive partition.
3. Monitoring the performance of the CPU:
And in the last part of this article, we will learn about the management and monitoring features of the Resource Monitor for the CPU.
Processes:
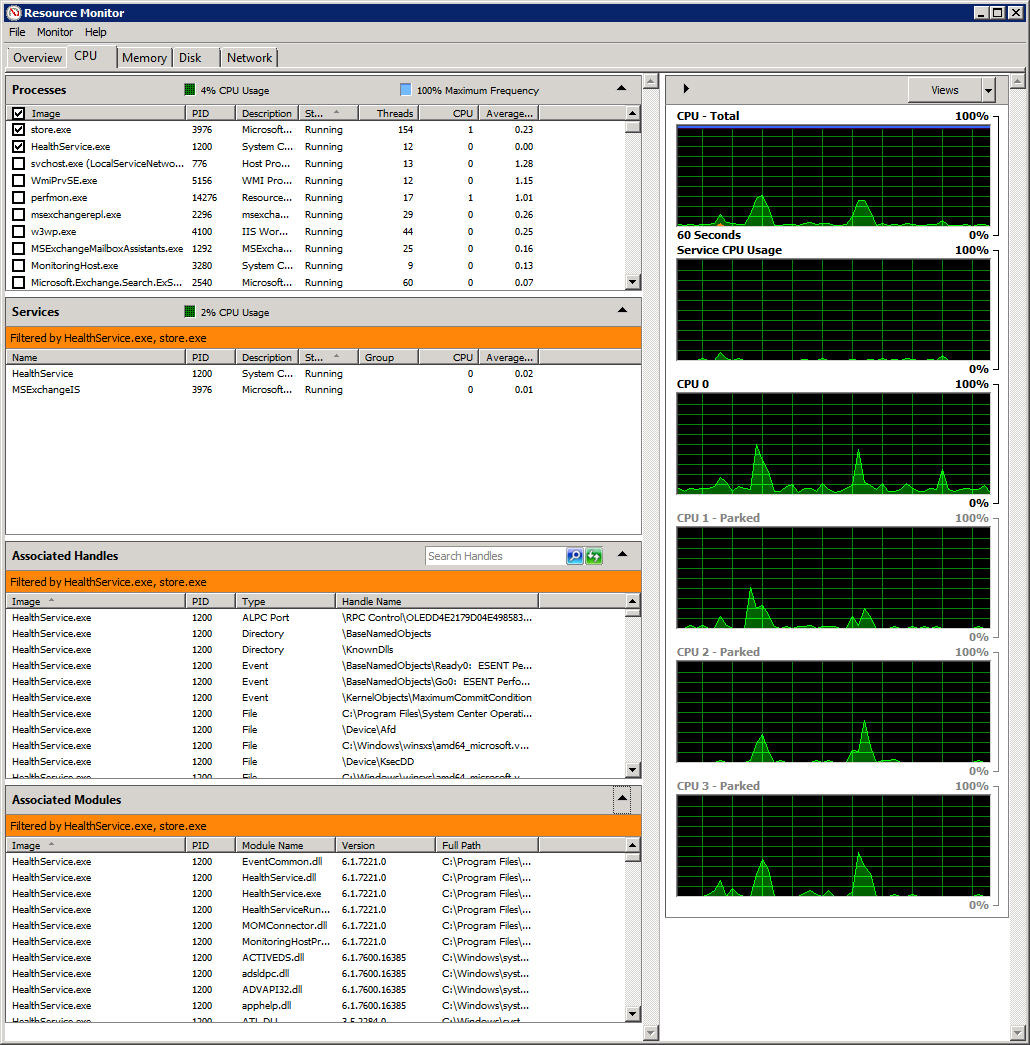
Similarly, the applications listed here mean using CPU resources.
- Name : the name of the executable file of the application using the CPU to operate.
- PID : corresponding ID number of the program.
- Description : a brief description of the active process
- Status : the status of the application.
- Threads : the number of processing data streams in active mode.
- CPU : CPU current operating rate in%.
- Average CPU : the average operating level of applications caused to the CPU within 60 seconds.
This Processes section provides quite a lot of useful information for users to manage and monitor the current status of the system. When detecting abnormal phenomena in the system, simply right-click on the application and select Analyze Wait Chain:
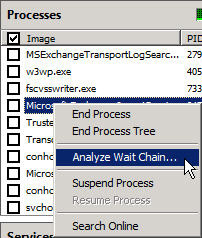
The results will be displayed by the system after analysis as follows:

Services:
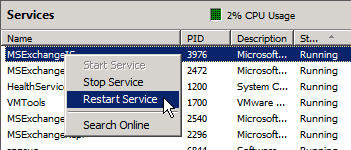
Here, the program will list each active service. For example in the screenshot above, you can see that only 2 related services are active. With such a design, users will be much easier to monitor the programs, applications or services that are related to each other.
Associated Handles:
When you want to determine if a program is processing a file or is working, how do you do it? With the Resource Monitor's Associated Handles feature, we can easily solve this problem.
In the Search Handles section, enter the name of the file or path you need to search, and the list of corresponding processes will be returned fully.
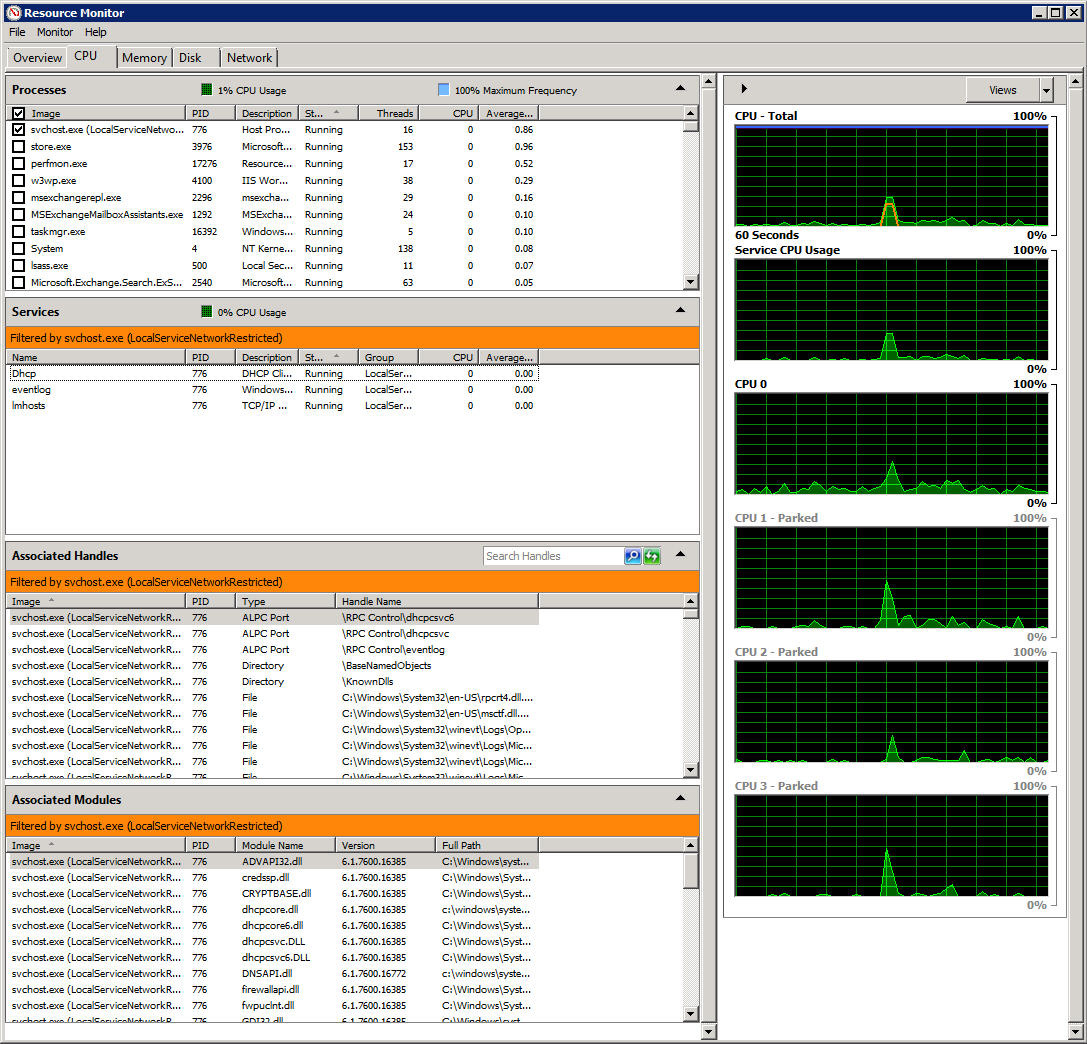
Associated modules
Modules here can be interpreted as files or programs that support the main application, for example, DLL files. We can use this feature to learn specifically about the cause or unusual problem that is happening in the system.
- Module name : the name of the module loaded by some application.
- Version : version of the file related to that module.
- Full Path: the full path of the module is active.
The graphs:
The window on the right side of this program will show some detailed charts, related to CPU measurement performance.
CPU - Total:
In this chart, we will see the small composition described by the green lines and the sky. Specifically, the blue section shows the total operating power of the system's CPU, while the green part is the current operating level that can be used.Resource Monitor is compatible with many Windows versions, and many CPU models now include the Clock level change function, depending on the power supplied and the ambient temperature.
Service CPU usage:
This chart shows the CPU activity level through services or programs that operate in Background mode.
CPU 0 - CPU 3:
For each individual kernel multiplier, how many% of performance is being used? In certain cases, different CPU cores will be marked as Parked - meaning they are temporarily deactivated.
Above are some basic information and functions about Windows system monitoring tool - Resource Monitor. Hopefully, with the above article, you have gained more experience as well as management skills as well as a clear definition of the source of the files and programs causing instability in the system. Good luck!


 How to display Internet speed in the status bar of Samsung phone
  How to align an Excel page so that when it fits on A4 page
  How to remove periods in numbers in Excel
  How to fix: The table in Word is overflowing
  How to use TeraCopy to speed up file copying
  How to Quickly Make a Table for WordPad