Table of Contents
This updated guide examines Learn About Microsoft Network Monitor Tool -- Part 1 and organizes the essential facts, background, and practical takeaways in clear American English.
- Signal sent from any computer in the network
- The exact address of the computer receiving the data
- The protocol is used to operate
- Data format is being transmitted
And many other features. In the following article, we will introduce you to some features of this utility.
Capturing:
Technically, Microsoft Network Monitor will collect all data streams in the system based on processes, and this process is called capturing. You can use this tool to monitor information on all frames on the system or individual parts of a certain frame.
Use Capturing in what situations:
The decision to use this tool will depend on a number of certain factors involved. For example, if there is only 2 computers in a simple system, there are 2 possibilities: when or not to enable the Firewall feature.
In the determination on computer 1, the system will check and detect any packets that are being 'ignored' by the rules of inbound Firewall, and for computer 2, the same rule will be applied, but this time based on the firewall's outbound rules:
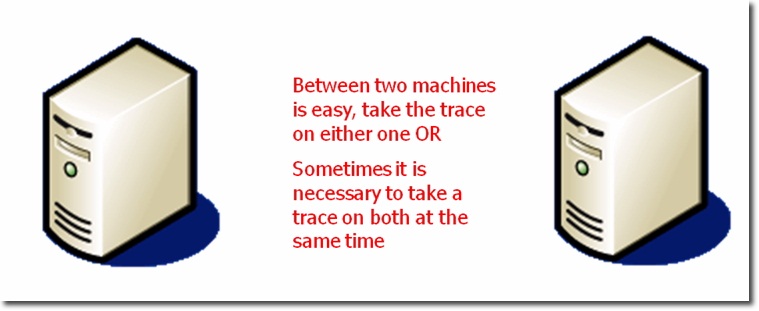
In actual models, you can apply based on the diagram below:
- On the network of Windows 7 Client
- The entire system inside and outside the Firewall
- The components are managed by Exchange Server
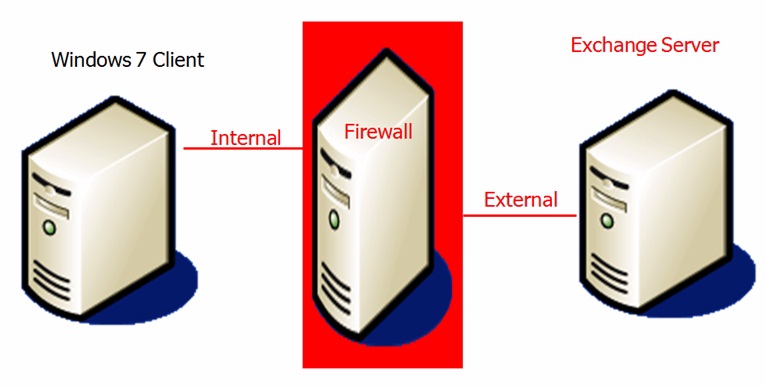
The monitoring process outside the Firewall system is only applied if the firewall's features have been set up with rules that ignore data streams that are not really needed. Thereby, even if these data streams are not through the Windows Client, it can still go through the Firewall and go to Exchange Server.
Collect data and use a cheat sheet:
When the network has become 'crowded' with more computers, it is recommended to use the cheat sheet to save the collected data. And in fact, there are problems that take days, even weeks, to be able to detect and process, because there are many data streams that are transmitted regularly in the system. Therefore, if you do not save this information, it will be very difficult and complicated if the system has problems.
The data to be saved includes:
- 'Symptoms' of the problem
- IP addresses of related computers
- Number of data packets analyzed
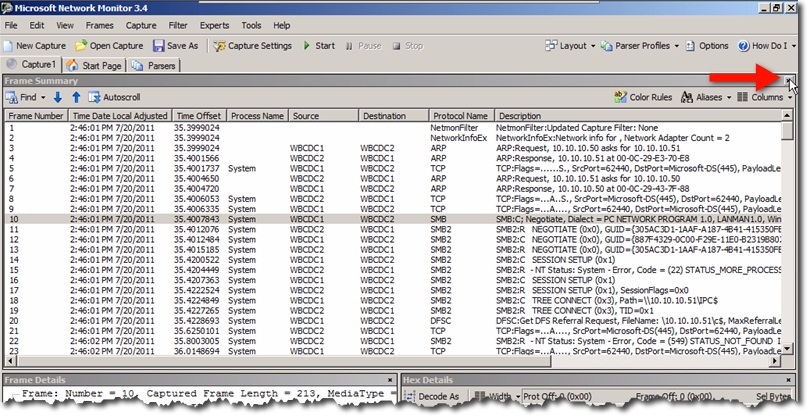
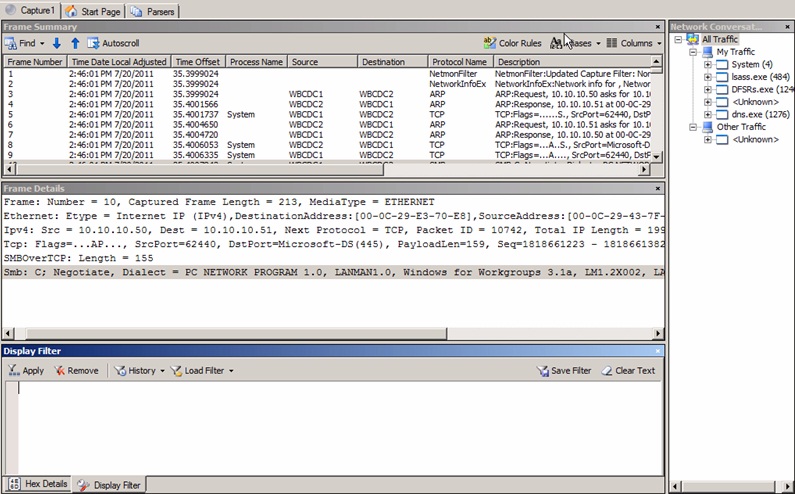
For example, suppose that we have 2 domain controllers, one is DC1 with IP address: 10.10.10.50 , and the remaining DC2 with IP address: 10.10.10.51 , the system has just completed the drive mapping. on DC1. The screenshot below is a Summary Frame parameter that includes the amount of traffic generated when the network drive is connected:

Packets related to drives are components that start with SMBs - Small Message Block . If in any case an error occurs on the system and we receive the Access denied message, then we must immediately identify and analyze the packets during that time period. And the information recorded in the cheat sheet will look like this:
network drive mapping lỗi thông báo - truy cập cho phép
source ip address = 10.10.10.50 destination ip address = 10.10.10.51
In more complicated cases, the administrator must try to record as much information as possible, so that if you encounter similar problems in the future, we will easily identify the main cause. corpses as well as how to fix them most effectively.
Clearly identify which information flows and data to store:
Technically, we can completely set, specify which parts of data to keep during the whole process. In fact, the system has 5 analytical templates available for users to choose, but if you want, we can still create your own templates. 5 samples of analysis available include:
- Pure : almost no analysis of any data stream and very limited filters
- HPC (High Performance Capture) : provides optimized filters, mainly focusing on the operating speed of the system, but is restricted with TCP and UDP protocols
- Faster Pasing : support some other protocols like ARP, HTTP, DNS, and NBTNS but not including SMB and SMB2.
- Default : default mode, applicable to all common protocols, including SMB, SMB2, and RPC.
- Windows : analyze all Windows-based and SQL-based protocols In simple words, the more data relevant to the information contained in the analysis samples, the longer the process will take, the longer the system will take to identify the cause and respond to the user. use. This information is usually set up, before the administrator starts the process, and to select or switch between these forms, click Parser Profiles> NetworkMonitor Parsers:

Adjust interface:
Depending on the requirements for each specific session, we can adjust, change Network Monitor 's main interface accordingly and achieve the highest efficiency. For example:
- Display or hide unnecessary windows
- Fixed the frequently used windows
- Change Simple external display interface, Diagnostic, Developer.
If you want to move a part of a window, just select and hold the Shift button, then drag and drop it from the previous position, and now you can move to any position that feels best:

If you want to close, just press the button with the X icon at the top right of that window:
To restore the default display mode, select View> Restore Default Layout:

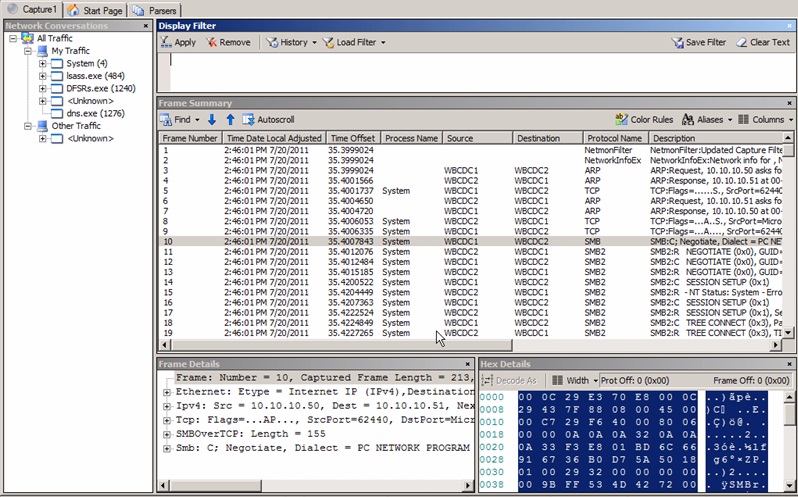
The default interface of Microsoft Network Monitor
And below are some of the layout templates available:

Diagnostic
Developer
And if you want to save these changes in the layout, just click the Save As button as shown below:
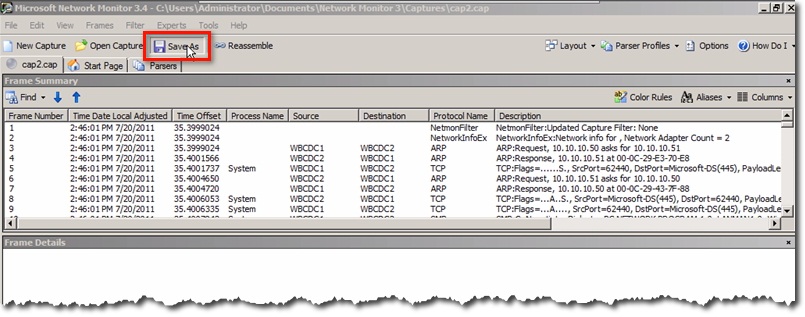
The Save As window is displayed, you want to name it with the extension *.cap ( Capture File ), then click the Save button:

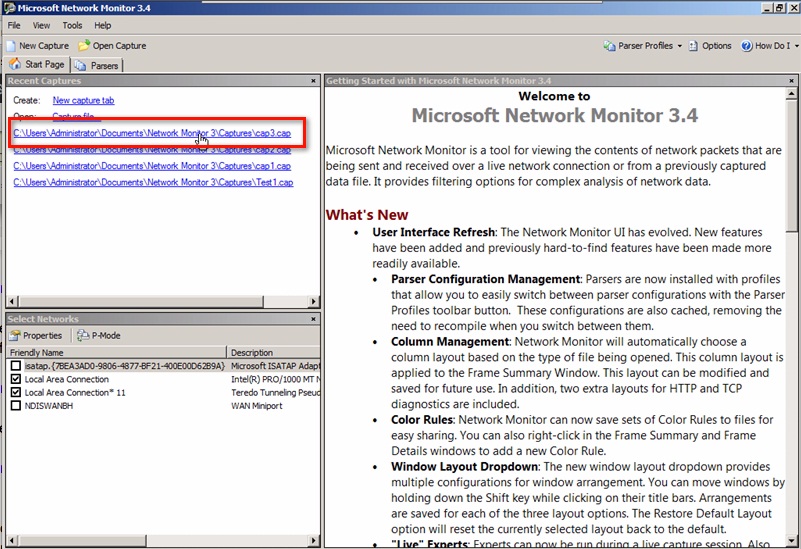
During the next use of Network Monitor , we will see the file system paths available and usable at any time:
Good luck!
FAQ
What is Learn About Microsoft Network Monitor Tool -- Part 1 about?
It provides a structured overview of instructions, explains the main context, and highlights practical takeaways for readers.
Why does this topic matter?
Understanding the main concepts helps readers evaluate the issue, avoid common mistakes, and make better-informed decisions.
How should readers use this information?
Use the guidance as a practical starting point, confirm details that may have changed, and follow current product, safety, or security recommendations.
Related Articles
 Working with Network Monitor (Part 2)9 minutes read
 Network Testing with Network Monitor 3.4 -- Part 18 minutes read
 Learn Pktmon: Windows 10's Built-in Network Monitoring Tool6 minutes read
 Learn About the Management and Monitoring Functions of Resource15 minutes read
 Working with Network Monitor (Part 1)9 minutes read
 Protocol: Working with Network Monitor (Part 4)8 minutes read
Reader Comments 0
Sign in with email or Google to join the discussion.