How to work with Performance Monitor performance monitor in Windows
Have you ever heard about Performance Monitor or PerfMon.exe or PerfMon.msc in Windows?
Table of Contents
Have you ever heard about Performance Monitor or PerfMon.exe or PerfMon.msc in Windows?Basically, Performance Monitor is a sophisticated tool that can be used to monitor the performance of your Windows computer or device.Through the Performance Monitor, you can monitor and analyze and make judgments about how your computer manages resources on the system.The information provided in the Performance Monitor can help you make more rational decisions about software selection and hardware upgrades, especially when your computer performance is lower than expectations.In addition, Performance Monitor is also useful in case you want to handle certain problems.Here's how to use Performance Monitor to analyze system performance, making you a 'professional analyst'!

NOTE: This guide is only applicable for Windows 10, Windows 7 and Windows 8.1.
How to start Performance Monitor in Windows
There are many ways you can start the Performance Monitor performance monitor.However, the simplest and most applicable method for all Windows versions is to use the system's default search engine.

In Windows 10, click or click the search item (magnifying glass icon) on your taskbar, and enter the keyword "Performance Monitor" or "perfmon", then click the returned result.
In Windows 8.1, you enter the keyword "perfmon" on the Start screen.The system will immediately return results, you click on that result.
In Windows 7, open the Start Menu and type "Performance Monitor" in the system's search field.In the list of returned results, click Performance Monitor.
How to analyze system performance with Performance Monitor
To begin analyzing the current performance of your computer, first click on the Monitoring Tools section on the main control panel of the program.In the Monitoring Tools section, click Performance Monitor (see illustration below).
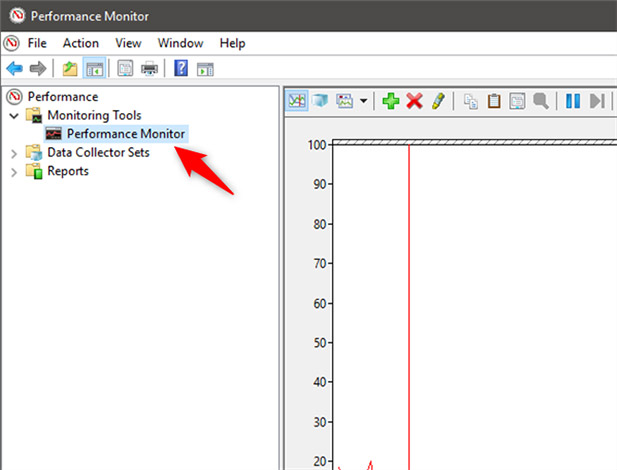
NOTE: If you want to see specifically how your computer works when using a certain set of apps and programs, be sure to open them right in this step so that the chart can show up as well. impact of that application and program on system resources.
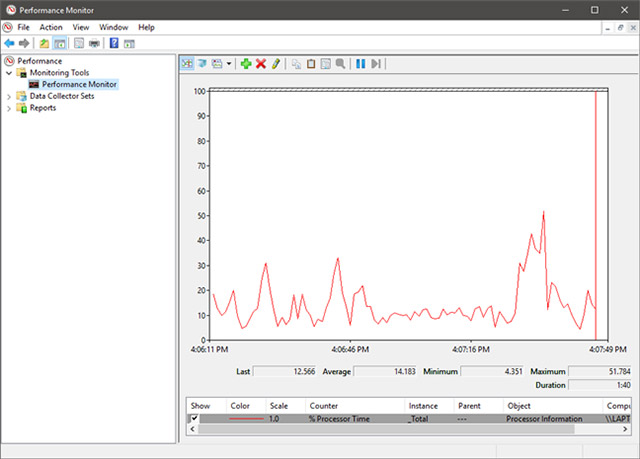
By default, the graph displayed by the Performance Monitor shows the processing time information, which is the time when the processor must work when you run programs on the system (shown). according to the percentage).Overall, this chart will give you a basic view of the system's processing capabilities.
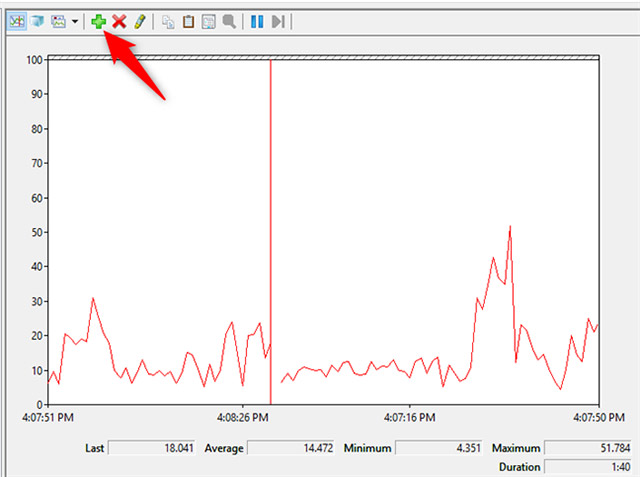
In addition, this chart can also be customized easily.You can add more columns and some other options.To get more in-depth analysis, you should add counters to the chart to show details about other data, by clicking the green plus sign at the top of the chart.
Then, the Add Counters window will open, in this window, you can select the counters you want to monitor in real time.There are many different counters and will be sorted by category.If you double click on the name of a counter, you will see there are several individual objects and can choose to track any object, as well as track all of those objects.
Once you have selected the counters and the objects you want to track, click the Add button.Newly added counters will be displayed on the right side of the window.When you click OK, they will be added to the chart from the Performance Monitor section.

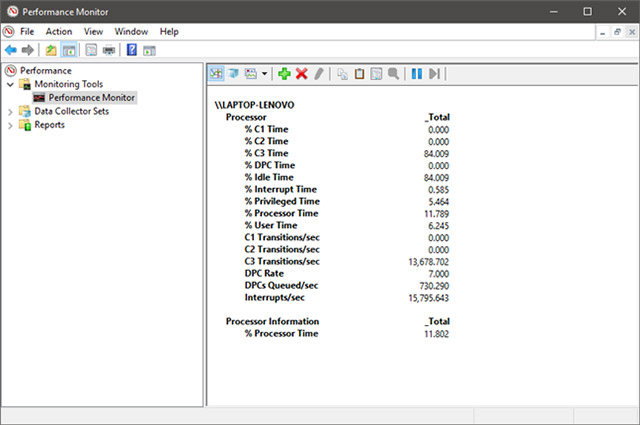
For example, in the chart below, the Processor counter has been selected for use.It displays slightly confusing data because it is technically heavy, but extremely useful as Interrupts / sec (the number of interruptions your processor is required to respond to. They are generated by the cities. hardware part such as the controller for hard disk and network card drivers, or% User Time (the total amount of time that Windows uses for user-mode operations).

Now you can do the same and select the activities you want to be tracked, use selected counters and see how they change in real time.
Customize how data is displayed in Performance Monitor
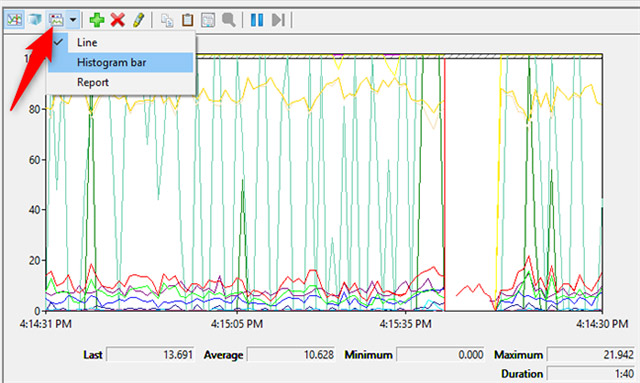
You can also customize the data displayed in different formats by clicking the Change graph type button (or by pressing CTRL + G on the keyboard) and selecting the display options such as Histogram bar or Report.
This image shows the data displayed in the Histogram format (chart).

And here is an example of how data is displayed in Report format.
You can also customize the way the data is displayed by clicking on the Properties button (highlighted in the image below) or pressing CTRL + Q.

These operations will open the Performance Monitor Properties window.Here, you can customize the display for each counter, such as color, chart type . You can also customize both Graph and Data tabs at this step.
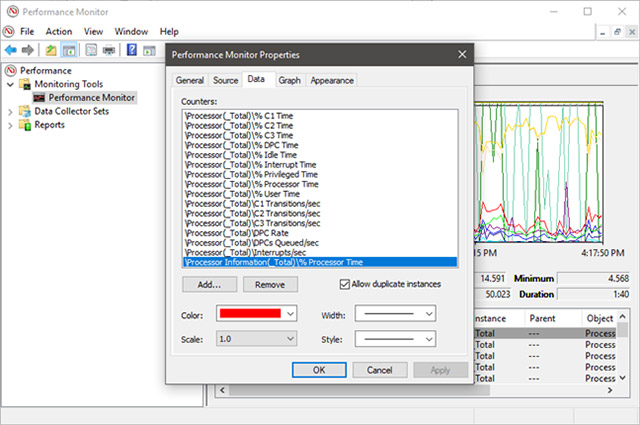
After you have finished customizing your preferences, don't forget to press the OK button to apply.
Which counters are most useful in Performance Monitor?
The data shown in the Performance Monitor graphic reports is often highly technical and will be somewhat confusing for ordinary users.However, there are a few counters that will contain information that is easier to understand, at least for general users.Here are some performance counters that can help you check if there is anything unusual in the system:
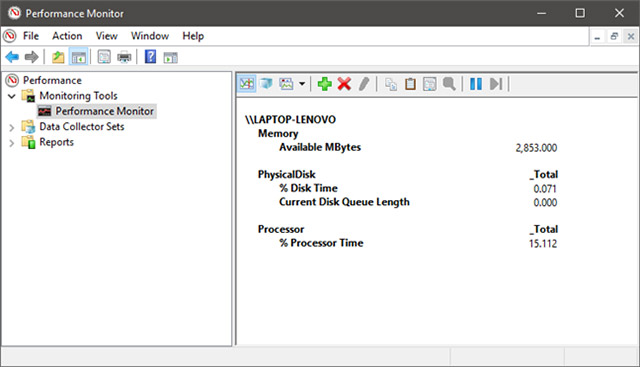
Processor ->% Processor Time : You can find this counter in the list of Processor counters.It shows you the specific time the processor spends on different tasks.If the value displayed is always above 80%, it means your processor is not strong enough to maintain the stability of the tasks you perform on your computer, the current The recoil, slow, overloaded phenomenon is very likely to occur.The situation solution will be to limit the performance of heavy tasks or multiple tasks at the same time, and in the long term, you will have no choice but to upgrade your processor.
Memory -> Available MBytes : Can be found in the list of device memory counters.You can add this counter to your chart to keep track of whether your system has enough memory to use.If the chart shows you that the available memory on the device is usually less than 10%, that means you don't have enough RAM.In this case, consider upgrading RAM so the system can operate more stably.
PhysicalDisk -> Current Disk Queue Length and PhysicalDisk ->% Disk Time : These two counters can all be found in the PhysicalDisk list.If the current disk queue length (Current Disk Queue Length) is higher than 2 and the closed disk time is over 100%, it is likely that your hard drive is too slow or even corrupted.In that case, you might consider upgrading your hard drive.
How to understand all the data provided in Performance Monitor?
In fact, the list of available counters in Performance Monitor is extremely long and it is difficult to express all in the scale of an article.However, if you are looking for a good knowledge base for reference, explaining all the confusing terms like% DPC Time or Page Faults / sec, read Performance Monitor Counters on Microsoft's TechNet page.There you will find complete information about each counter found in the standard Performance Monitor report list.
summary
This article has shown you how to open and basic information about Performance Monitor, as well as how to apply counters to track your system's performance.This is a really useful tool if you know how to take advantage of it.Wish you build a powerful system!
See more:
- These factors determine the speed of the computer
- Which upgrade will improve your computer's performance the most?
- 10 ways to improve computer performance
- How to do, customize in the article will help your Windows 10 "as fast as the wind"
Was this article helpful?
Your feedback helps us improve.
Related Articles
 11 ways to start the Performance Monitor performance monitor in Windows10 minutes read
 How to Generate a Windows System Performance Report2 minutes read
 How to monitor GPU performance in Task Manager of Windows 109 minutes read
 5 must-have features when buying a new work monitor6 minutes read
 How to Check System Performance in Windows 83 minutes read
 7 Smart Ways to Use Your Monitor Without a Computer6 minutes read
Reader Comments 0
Sign in with email or Google to join the discussion.