How to Make a Bar Chart in Word
Whether you need to have a bar chart for your school project or business presentation, or just want it because it looks cool, this wikiHow will show you how to add one. Open the Microsoft Word program. You can also double-click an existing...
Table of Contents
Method 1 of 2:
Word 2013 and Later
-
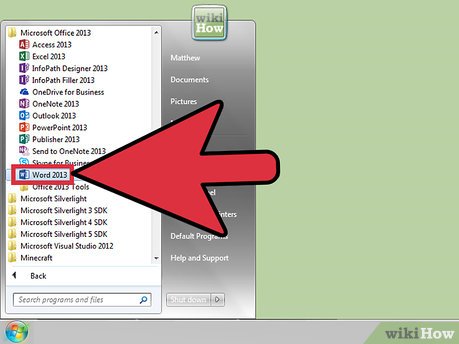 Open the Microsoft Word program. You can also double-click an existing Word document to open it in Word.
 -
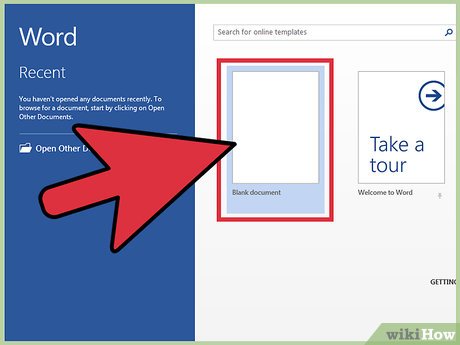 Click the "Blank document" option. Skip this step if you're opening an existing document.
 -
 Click Insert. This is a tab in the top left corner of Word's interface.
 -
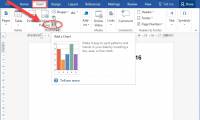
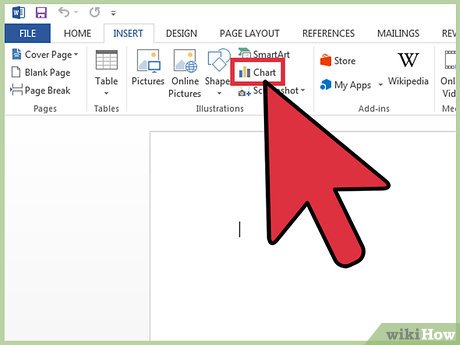 Click Chart.
 -
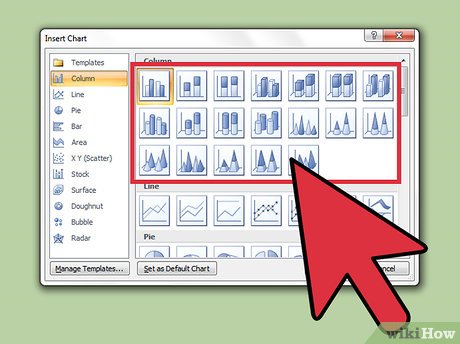
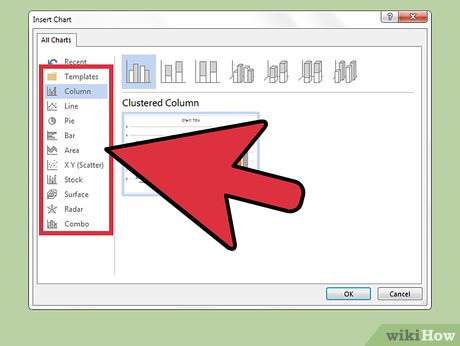 Click a chart layout. These are listed on the left side of the Chart menu.
- Depending on the information you need to display, your preferred format will vary.
-
 Click on a chart style. Stylistic options appear above your chosen chart layout.
 -
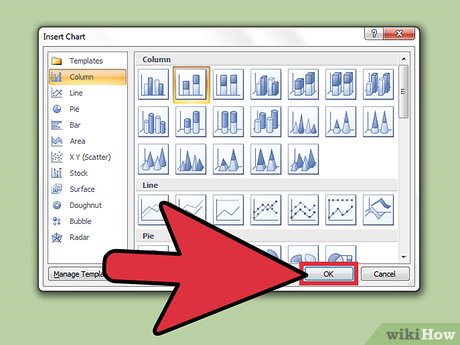
 Click OK. A Microsoft Excel window will pop up beneath the graph image.
 -
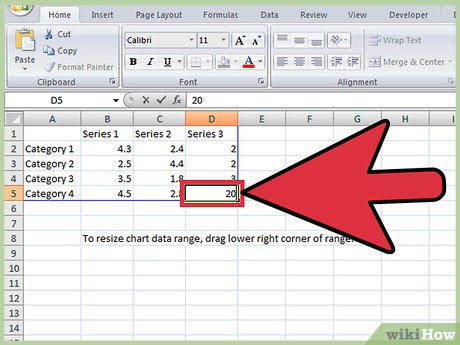
 Add data to your chart. To do so:
- Click an Excel cell.
- Type in a data point.
- Press ↵ Enter.
-
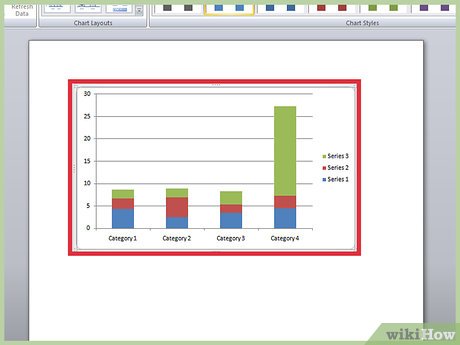
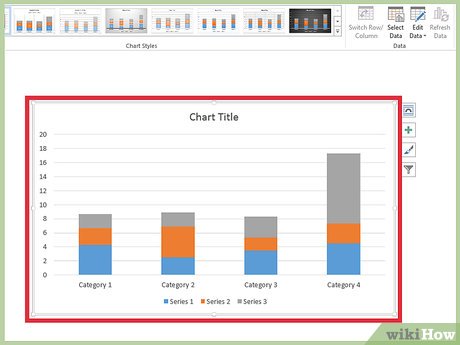 Click the X in the Excel section. This will close the Excel window--your data will be saved in your chart.
Method 2 of 2:
Word 2007 and 2010
-
 Open the Microsoft Word 2007 program. You can also double-click an existing Word document to open it in Word.
 -
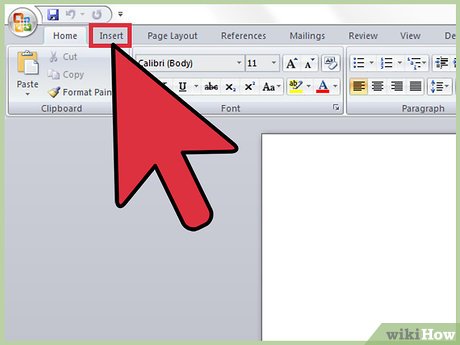 Click Insert. This is a tab in the top left corner of Word's interface.
 -
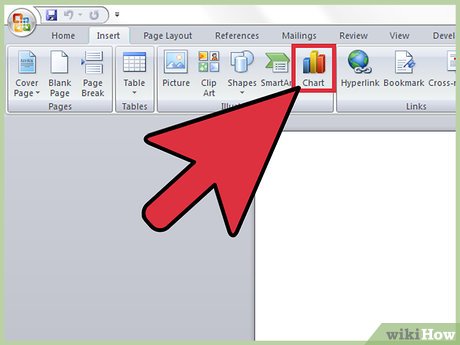 Click Chart.
 -
 Click a chart layout. These are listed on the left side of the Chart window.
- Some types of data will work better with specific layouts than with others.
-
 Click on a chart style. Stylistic options appear to the right of your chosen chart layout.[1]
 -
 Click OK. A new window will open with Microsoft Excel 2007 data.
 -
 Add data to your chart. To do so:
- Click an Excel cell.
- Type in a data point.
- Press ↵ Enter.
-
 Close Excel when you're done. Your chart should immediately change to reflect your data input.
Was this article helpful?
Your feedback helps us improve.
Related Articles
 Instructions for inserting, drawing and creating charts in Word 20073 minutes read
 How to draw a chart in Word6 minutes read
 How to create a pie chart in Word7 minutes read
 Create and insert Word 2016 charts5 minutes read
 How to create a chart in Word 20162 minutes read
 8 types of Excel charts and when you should use them9 minutes read
Reader Comments 0
Sign in with email or Google to join the discussion.