How to debug websites on iPad
With billions of mobile users today, building websites that can be viewed on mobile devices is inevitable. Fortunately, users have many tools and options to debug websites on the mobile platform.
Table of Contents
With billions of mobile users today, building websites that can be viewed on mobile devices is inevitable. Fortunately, users have many tools and options to debug web pages on mobile platforms, such as Adobe Edge Inspect, Google Chrome Emulation or XIP.io.
If only developed in macOS and iOS environments, you may not need those third-party tools. Apple has provided a set of tools for this.
In this article, we will show you how to use this toolkit to access and debug static websites as well as WordPress websites for iOS for iPhone and iPad. Let's start!
Begin
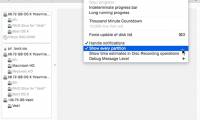
First, launch Safari and activate Developer Tools through Safari> Preference . On the Advanced tab , check the Show Develop menu in the menu bar .
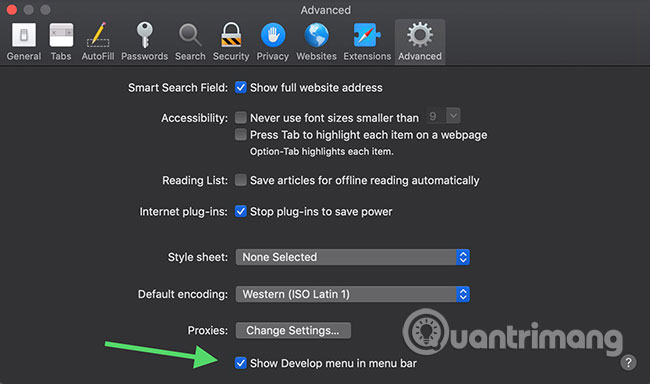
A new menu called Develop will appear in the Safari menu bar.

Then, in iPad or iPhone, go to Settings> Safari . Similarly, in the Advanced menu , activate Web Inspector.

For WordPress based websites
A relative path is required for CSS, Images and JavaScript links to be loaded correctly in the iPad or iPhone. If you are developing websites based on WordPress, all paths must be absolute. To turn them into a relative path, install and activate the Relative URL plugin.
When enabled, path URLs will change from:
http://localhost:8888/wordpress/
into:
/wordpress/
Debugging website
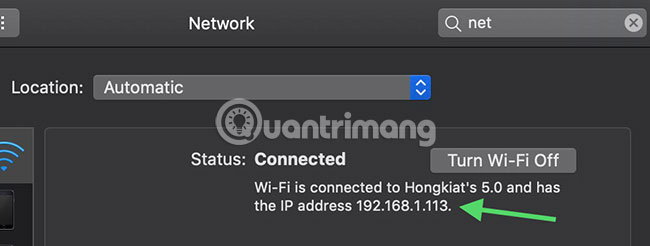
First, you need to know the network IP address. Go to System Preference> Network . There, you will find the IP address. Also, ensure that Apple devices - Mac, iPad, iPhone - are connected in the same network to be able to access the wireless website on the iPad or iPhone.
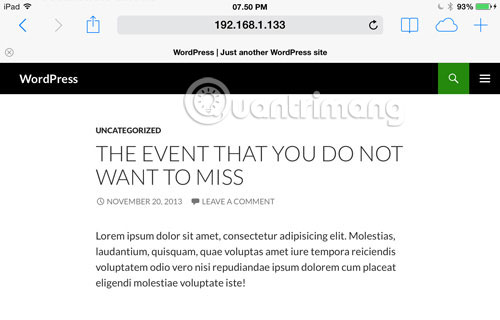
On the iPad or iPhone, launch the Safari application and access localhost: 8888 followed by the web project directory - for example localhost: 8888 / wordpress. If you set up the local server using MAMP, localhost: 8888 will be the default local server address.
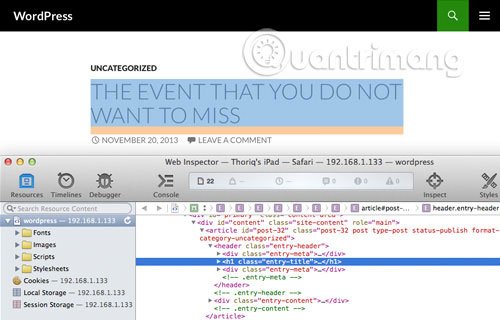
As you can see below, we are viewing a WordPress-based website with the iPad.
Moreover, to be able to debug the site using the Developer Tools, you need to connect the iPad or iPhone to the Mac with a USB cable. Then, in Safari, go to the Develop menu and select the connected device.
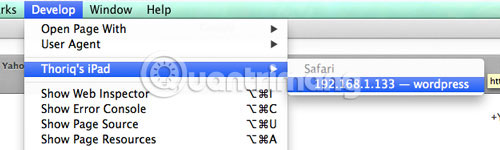
Everything is complete.
In the following screenshot, when selecting the DOM Tree (Document Object Model) from Developer Tools, you can see the corresponding elements on the iPad or iPhone highlighted. Now you can technically debug your site in the iPad or iPhone, just like you do on the desktop.
Hope you are succesful.
Was this article helpful?
Your feedback helps us improve.
Related Articles
 Google Chrome and Edge encountered strange errors, automatically generated random debug.log files on the desktop3 minutes read
 How to start with Android Debug Bridge5 minutes read
 How to debug a Windows application with Process Monitor5 minutes read
 Activate Disk Utility's Debug menu6 minutes read
 How to block websites with bad content on Safari for iPhone and iPad3 minutes read
 How to View Flash-Based Websites on iPad4 minutes read
Reader Comments 0
Sign in with email or Google to join the discussion.