How to debug a Windows application with Process Monitor
One way to get around the problem is to use a free official Microsoft utility called Process Monitor. This tool will help you diagnose and debug any Windows application errors or problems.
Table of Contents
Do you have Windows 10 apps that aren't working as expected? Maybe it's too slow, crashes suddenly, or has loads of problems to pinpoint. One way to get around the problem is to use a free official Microsoft utility called Process Monitor. This tool will help you diagnose and debug any Windows application errors or problems.
Download and install Process Monitor
SysInternals's Process Monitor (ProcMon) utility has been around since 2006 and does a lot more than diagnose application problems. It provides the ability to view all registry keys, file system locations and network traffic.
However, it does not capture mouse pointer movements or hardware-related changes. If your goal is to capture malware, identify troubled applications, or have a high level overview of your Windows PC, then ProcMon is the most advanced tool to have.
Download Process Monitor here
No settings involved, but you must agree to the SysInternals software license terms while running the .exe file.
Let Process Monitor list all the events in your Windows system. All running programs are automatically analyzed.
Diagnose problems with Windows Process Monitor
When the program lists insights, you can be overwhelmed to see so many rows and columns. There are millions of entries. You don't have to care about everything, just pay attention to the following:
- Process name
- Process ID (PID) - Process ID: A four or five digit number
- File path
- Result code: 'Success' or more entries, such as 'name not found', 'Reparse', etc.
To quickly jump to troubled apps, go to Tools> Process Tree .

The dashboard will have all the applications open and running in your system. A complete green block in the 'Life Time' column usually indicates there is no problem in the relevant application.
If Windows 10 programs and system are up to date, many registry errors and file health problems won't cause any trouble. For updated related issues, you can use another utility called SetUpDiag.

Scroll down to the problematic event and click 'Go to Event' to navigate to the problem. In the next screen, ProcMon diagnosed many problems with Tencent's QQ Browser. You can recognize a process ID ('3428') by its .exe file.
Once the problem source is identified, you need to use an option called 'Filters' . By right-clicking and adding a 'Include' filter for a particular executable, you focus on just a specific app, then apply the filter. Depending on the number of entries, it may take some time. There are already thousands of entries for this filter.
You can also rule out certain results like 'Success' or 'Buffer Overflow' , as they show the application is not having a problem. This will narrow the search even further.
For now, focus on the most common resulting code for the problematic application. The 'Name not found' issue is the most common phenomenon here with thousands of entries, meaning the caller tried to open an object that didn't exist.
In other words, the installation itself had an error. So you have diagnosed the root of the problem.

Final troubleshooting
Here, the article will show the final fix for the above program. Before resolving the diagnosed problem, requiring uninstall, you may want to save the ProcMon file from File> Save so that you can review the related issues in the future.
Saving the file also gives you the filter presets you just created. If you want to go back to the default settings, click Reset.
As shown here, the program needs to be uninstalled due to the lack of many DLLs. Uninstalling the program is not always easy, so ProcMon has a right-click option called 'Search online'. It leads to the Uninstall screen .
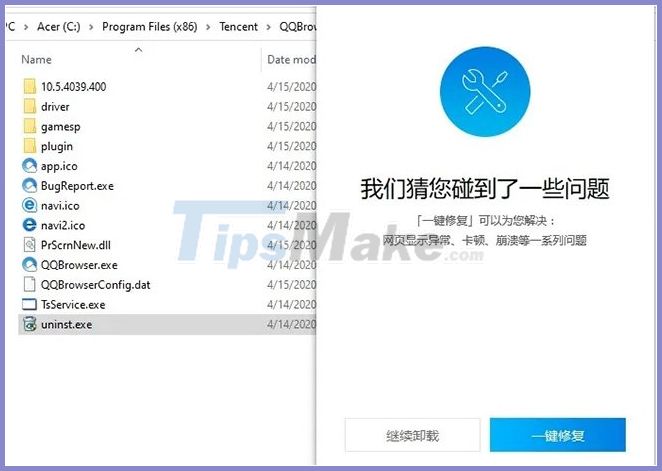
Clicking on the uninstaller removed the program completely.
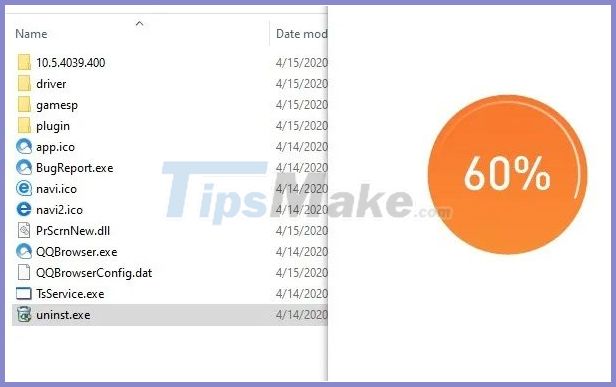
The uninstallation step is a nuclear option ("extreme" option) but it works with programs that have too many files missing.
When re-opening ProcMon with the same filter presets, the problem with Tencent's QQ Browser is gone.
You can use Windows Process Monitor to diagnose Windows application errors and resolve problems. It only takes a little bit of work to identify the source of the main problem.
Was this article helpful?
Your feedback helps us improve.
Related Articles
 How to find the Process ID of the application on Windows 106 minutes read
 How to start with Android Debug Bridge5 minutes read
 Google Chrome and Edge encountered strange errors, automatically generated random debug.log files on the desktop3 minutes read
 6 software to monitor Windows 10 hard drive activity9 minutes read
 How to Debug a Node.js Application in Visual Studio Code7 minutes read
 How to monitor network usage for Linux processes4 minutes read
Reader Comments 0
Sign in with email or Google to join the discussion.