- Summary of data in groups in Excel
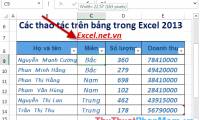
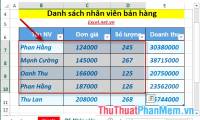
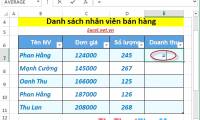
 Instructions on how to aggregate data in groups in Excel. With a large amount of data, statistical data is very complicated. Here, with Excel 2013, the Subtotal feature helps you
 - Manipulating tables in ExcelGuide you to create tables in Excel. To create the table you perform the following steps: Step 1: Go to the Insert - Tables - Table tab: Step 2: The Create Table dialog box appears
- Table operations in ExcelInstructions on table operations in Excel. When working with tables you should pay attention to the following: 1. Edit the width of rows and columns. There are many ways to edit
- Manipulating tables editing in ExcelInstructions to manipulate tables in Excel. 1. Insert rows and columns in the table: - For example, want to insert 1 column after salary column 1 day: Step 1: Select the column
- Format borders and background colors for tables in ExcelInstructions on how to format borders and background colors for tables in Excel. Step 1: Select the table you want to create a border for - Design - Quick Styles - select the table
- Top 3 software to read PDF files bestPDF is the most commonly used file format. With this format will minimize the editing of content. The following article introduces you to the top 3 best pdf file readers today.
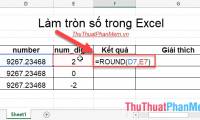
- Round a number in Excel (ROUND function)Instructions on how to round numbers in Excel, help calculate faster Depending on how to round the number of digits after and before the comma, there are many number rounded
- How to reduce the size of Excel filesInstructions on how to reduce the size of Excel files. In order to reduce the file size, you need to determine the reason why your file size is very large. If you can't find it,
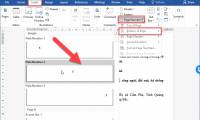
- Instructions for page numbering in Word, align page numbers, delete page numbersThe following is a guide to page numbering in Word, aligning page numbers, and deleting page numbers to help you locate and search easily in large documents.
- COVARIANCE.P function - The function returns the covariance of a set, the product of the average of degrees of instruction for each pair of data points in ExcelCOVARIANCE.P function: Returns the covariance of the population, the average of the product deviations for each pair of data points in the two data sets Syntax: COVARIANCE.P
- COVARIANCE.S function - Returns the covariance pattern, the average of product deviations for each pair of data points in two data sets in ExcelCOVARIANCE.S function: Returns the covariance, the product of the deviations for each pair of data points in two data sets Syntax: COVARIANCE.S (array1, array2)
- INTERCEPT function - The function returns the point at which the line will intersect the y-axis by using the existing x and y values in ExcelINTERCEPT function: The function returns the point at which the line will intersect the y-axis by using existing x and y values. Use the function when you want to determine the
- MODE.SNGL function - Function that returns the most frequently occurring, or the most repeated values in an array or data range in ExcelMODE.SNGL function: The function returns the most frequently occurring, or the most repeated value in an array or range of data. Support functions from Excel 2010 onwards. Syntax:
- NORM.S.INV function - The function returns the inverse of the normalized distribution with an average value of 0 and a standard deviation of 1 in ExcelNORM.S.INV function: The function returns the inverse of the normalized distribution with an average value of 0 and a standard deviation of 1. Support from Excel 2010 onwards.
- PERCENTRANK.EXC function - The function returns the rank of a value in a dataset as a percentage excluding values 0 and 1 in ExcelPERCENTRANK.EXC function: The function returns the rank of a value in a dataset as a percentage excluding values 0 and 1. The function supports Excel 2010 and later versions.
- PERCENTRANK.INC function - The function returns the rank of a value in a dataset as a percentage including values 0 and 1 in ExcelPERCENTRANK.INC function: The function returns the rank of a value in a dataset as a percentage including values 0 and 1. The function supports Excel 2010 and later versions.
- PROB function - The function returns the probability that values in a range are between two limits in ExcelPROB function: The function returns the probability that values in a range are between two limits. Syntax: PROB (x_range, prob_range, [lower_limit], [upper_limit])
- RANK.EQ function - Function returns the rank of a number in a list of numbers, returns the highest rank when multiple values with the same rank in ExcelRANK.EQ function: The function returns the rank of a number in a list of numbers whose size is in correlation with other values. If multiple values have the same rank -> the
- Operations with blocks in ExcelThe following article shows you how to manipulate blocks in Excel. Frequently used operations in spreadsheets when working with blocks: 1. Select blocks of contiguous cells. Place
- How to enter formula data in ExcelShow you how to enter formula data in Excel. Working with Excel you can not help but work with formulas and functions in Excel. Formula data input is a type of data entry through


Most viewed
- How to quickly add and delete rows and columns in Excel
- The most accurate way to check your typing speed.
- How to display the Ruler in Google Docs
- How to change the Office 2016 interface to make it look better.
- Common calculation functions in Excel, formulas, and examples.
- How to install Rapid Typing Tutor and practice 10-finger typing.
- How to convert Excel files to PDF for free, extremely simple
- Top-rated typing practice games for children.


