3 best system monitoring tools for Ubuntu
If you are using Ubuntu, system monitoring tools will help detect any corrupted errors or services before they affect users.
As the number of devices, servers, and services in your business or organization increases, that's when systems must be monitored. Monitoring the system, in place or in the cloud, includes capabilities, operations, as well as server and application health. This process is designed to include all computing resources to find and solve problems in real time, before they happen.
If you are using Ubuntu, system monitoring tools will help detect any corrupted errors or services before they affect users.
The most basic tool is System Monitor, a built-in utility for Linux, which acts as the Windows Task Manager, and provides basic activity monitoring information for running processes and even cost-effective factors. most resources.
However, there are sophisticated system monitoring tools that show more resource usage information for memory, CPU, disk and network connectivity.
Here are the top 3 system monitoring tools that can be used with Ubuntu.
Learn about Nagios, Glances and Htop - 3 Ubuntu system monitoring tools
- 1. Site24x7's monitoring platform
- 2. Nagios
- Nagios Core
- Nagios XI
- 3. Glances
1. Site24x7's monitoring platform
With Site24x7's monitoring platform, you can eliminate Linux server outages and performance issues by constantly tracking over 60 key performance metrics, including the load average, CPU, memory, disk space, network bandwidth utilization, recent events, and Linux processes.
Configure thresholds for key performance metrics and receive instant alerts via SMS, emails, mobile app push notifications, and other ITSM and collaboration tools whenever these thresholds are breached.

Site24x7 lets you automate incident remediation and makes your IT operations more agile and efficient.
Key features:
- Better visibility into the processes that affect your server health and performance with the exclusive Top Process Chart
- Services monitoring and syslog monitoring for Linux servers
- A single console for MSPs to monitor their customers' IT infrastructures
- Monitored metrics pushed via StatsD
- Support for over 100 plugins, including Redis, MySQL, and NGINX
2. Nagios

This system monitoring tool for Ubuntu provides complete monitoring of servers and workstations - including service status and processes, operating system metrics, file system usage, etc.
Nagios is a powerful, reliable, expandable and customizable software (although the configuration is complex). As a standard that has existed for a long time in the field of network and system monitoring, Nagios has great benefits such as fast detection of protocol errors and loss of life, plus an increase in services and machines. master and application.
Two solutions available for system monitoring are Nagios Core and Nagios XI.
Nagios Core

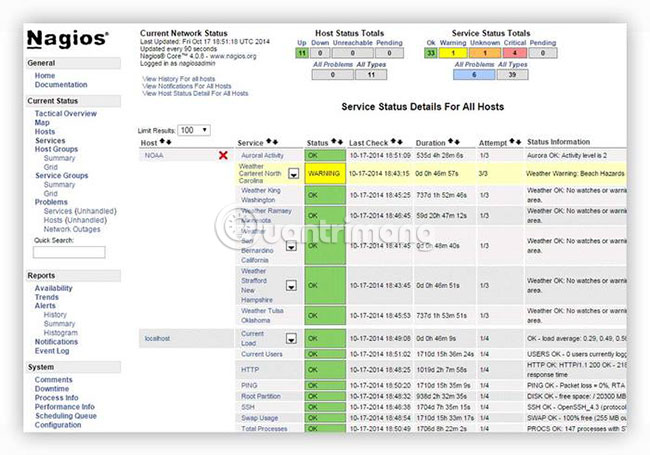
This is the free open source version that monitors servers, applications and services. Nagios Core comes with features like a basic user interface with network maps, SMS reports, email and basic reports.
Nagios Core monitors critical IT infrastructure components, from system, server, application, service and network data metrics. After that, Nagios Core sends notifications via SMS, email or custom script when important components fail and recover, so administrators are always informed about important events.
Available reports provide a historical record of events, deactivation, notifications and alert responses for future review, plus advanced charts to plan upgrades before Obsolete systems are at risk of malfunction.
This is a powerful open source option for monitoring Ubuntu systems, with great features like web interface, multi-tenant capabilities (a single version of the software application that serves many customers). and structure, expandable through integration with internal or third-party applications and community-developed add-ons.
It will take some time to learn when you start, but an active community is always ready to help if you need assistance.
Nagios XI

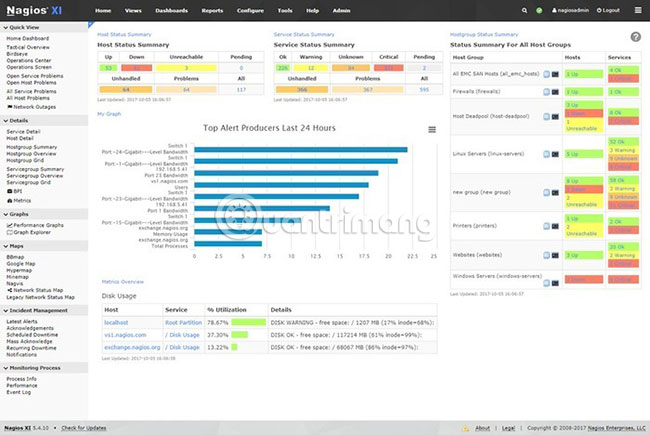
This is a commercial variant of the Nagios tool, which has a richer feature range and supports automatic configuration.
Nagios XI's powerful features (more than Core offers) include the powerful Nagios Core 4 monitoring tool, which provides the highest level of server performance monitoring. Nagios XI also includes configuration guides to guide users through monitoring devices, services and applications, taking snapshots to save recent configurations and reverting to the old configuration if desired.
You can customize the design, layout and options according to each user by using the updated GUI, so customers and collaborators get the flexibility they want. Nagios XI also features a custom role assignment to ensure a safe environment.
Advantages of Nagios:
- Easy to use
- Provide free and paid options (with a 60-day trial version)
- Comprehensive IT infrastructure monitoring, since all critical infrastructure components are monitored
- Allows multiple users to access the web interface and see the related infrastructure status
- Quick configuration with just a few simple clicks
- Easy to set up and manage user accounts
- Extensive structure using add-ons
3. Glances

This is a multi-platform data center monitoring tool, running on GNU / Linux, macOS, Windows and BSD operating systems. Glances are written in Python, using the psutil library to retrieve information from the system, providing users with lots of content at a glance.
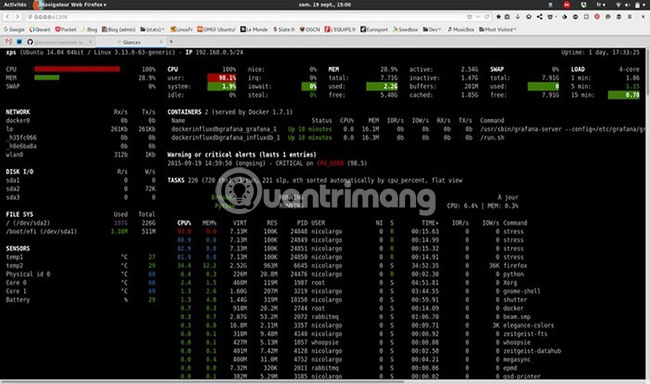
You can use Glance to monitor load averages, CPU, memory, I / O drives, network interfaces, connected devices, using file system space, etc.
One of the key features of Glance is the ability to set thresholds in configuration files with 4 options, displayed in different colors: OK (green), Careful (blue), Warning (purple) and Critical (red).
Thresholds are set at 50, 70 and 90, corresponding to Careful, Warning and Critical. You can customize these files using the file 'glances.conf' found in the '/ etc / glances /' directory.

See important information such as average CPU load, disk I / O read / write speed, current disk usage for attached devices and top processes along with CPU / memory usage. of them.
The downside of having all this information is that Glances tends to use a significant amount of CPU resources.
If you need help with Glances, use the wikis available on the site. You can also contact other developers and users on Twitter, chat features for developers and user groups.
Advantages of Glances:
- Easy to install because it is available on the Ubuntu repository
- Show more information than other monitoring tools
- Web-based GUI for flexible monitoring
- Can monitor the system remotely
What system monitoring tool do you use for Ubuntu? Leave comments in the comment section below!


 11 best MySQL monitoring tools for adjusting and managing SQL Server performance
  Best SNMP monitoring software
  Smart AI rings can monitor heart rate and many other health indicators
  Comprehensive network monitoring tool set
  Hanoi Telecom launches an anti-network attack solution
  CCleaner 5.45 is wiped out by collecting user data, if you are using it, remove it immediately