How to automate system monitoring with Python
With a single library, you can monitor a wide range of system metrics and ensure everything runs smoothly. Here's how to automate system monitoring with Python.
Table of Contents
With a single library, you can monitor a wide range of system metrics and ensure everything runs smoothly. Here's how to automate system monitoring with Python .

Most organizations rely heavily on IT infrastructure to run their operations. Unexpected system failures or performance degradation can cause disruption, financial loss and loss of reputation.
Automated system tests are important to ensure IT infrastructure remains stable and reliable. By monitoring key metrics and detecting abnormalities promptly, you can minimize downtime.
Identify health checks
Determining the health checks you want to perform on the system is essential. You should establish clear criteria for the activities you want to monitor and why. Start by identifying the basic goals of the system and the function or service it provides.
Then, set performance standards based on historical data and ensure status checks evaluate efficient use of system resources. Finally, identify problematic thresholds. The resource usage percentage you consider high or low. At what point does the system trigger a notification?
Select the library and set up the environment
To automate system monitoring in Python, you will need the following libraries to collect metrics and then schedule checks.
- Psutil : This is a cross-platform library, providing an interface to retrieve information when using the system (CPU, memory, disk, network, sensors).
- Schedule : This library provides a simple way to schedule tasks to run at certain intervals.
- Time : A built-in Python library that you will use for time-related operations.
- Logging : Another available library that you will use to create system health check logs.
Start setting things up by creating a new Python virtual environment. This will prevent potential library version conflicts. Then, run the following terminal command to install the libraries needed with Pip:
pip install psutil scheduleAfter installing the library on your system, your environment is ready.
Import the necessary libraries
Create a new script, monitoring.py , and start by importing the necessary libraries:
import psutil import schedule import time import loggingImporting these libraries will allow you to use the functionality they provide in your code.
Logging and reporting
You need a way to record system health test results. Logging acts as an important tool to record and retain a timeline of events and handle errors in code. It also plays an important role in performance analysis.
Use the existing logging library to create logs for this project. You can save log messages to a file named system_monitor.log .
# Hàm ghi thông báo def log_message(message): # Cấu hình bản ghi logging.basicConfig(filename='system_monitor.log', level=logging.INFO, format='%(asctime)s - %(message)s') logging.info(message)For reporting, print a warning message on the console so that it acts as an immediate notification of errors that require attention.
# Hàm in cảnh báo cho console def print_alert(message): print(f"ALERT: {message}")The status check functions will use those functions to record and report related search results.
Create functions that check status
For each health check, define a function that will encapsulate a specific test that evaluates each aspect of the infrastructure.
Monitor CPU usage
Start by defining a function that will monitor CPU usage. It serves as an important indicator of overall system performance and resource usage. Using too much CPU slows down the system, causing it to become unresponsive, even crash, and sometimes interrupt essential services.
By regularly checking CPU usage and setting appropriate thresholds, system administrators can identify system bottlenecks, resource-hungry processes or potential hardware failures.
# Hàm kiểm tra sức khỏe def check_cpu_usage(threshold=50): cpu_usage = psutil.cpu_percent(interval=1) if cpu_usage > threshold: message = f"High CPU usage detected: {cpu_usage}%" log_message(message) print_alert(message)This function checks the system's current CPU usage. If CPU usage exceeds the limit in percentage, it logs a message indicating high CPU usage and outputs a warning.
Monitor memory usage
Define another function that will monitor memory usage. By regularly monitoring memory usage, you can detect leaks, resource-hungry processes, and potential problems. This method prevents system delays, crashes, and shutdowns.
def check_memory_usage(threshold=80): memory_usage = psutil.virtual_memory().percent if memory_usage > threshold: message = f"High memory usage detected: {memory_usage}%" log_message(message) print_alert(message)Similar to checking CPU usage, you set memory usage to high. If memory usage exceeds the threshold, it logs and prints a warning.
Monitor drive capacity
Define a function that will manage disk space. By continuously monitoring free space on your drive, you can handle potential errors that cause resource depletion. Running out of disk space can cause system crashes, data corruption, and service interruptions. Checking disk capacity helps ensure there is enough data storage space.
def check_disk_space(path='/', threshold=75): disk_usage = psutil.disk_usage(path).percent if disk_usage > threshold: message = f"Low disk space detected: {disk_usage}%" log_message(message) print_alert(message)This function checks the disk space usage of a specific path. The default path is the root directory. If the drive falls below this threshold, it logs and prints a warning.
Monitor network access
Define a final function. It will monitor your system data flow. It will help detect unexpected spikes in network access early, which could be signs of security breaches or infrastructure errors.
def check_network_traffic(threshold=100 * 1024 * 1024): network_traffic = psutil.net_io_counters().bytes_recv + psutil.net_io_counters().bytes_sent if network_traffic > threshold: message = f"High network traffic detected: {network_traffic:.2f} MB" log_message(message) print_alert(message)This function monitors network access by calculating the total number of bytes sent and received. This threshold is in bytes. If network access exceeds this threshold, it logs and prints a warning.
Implement monitoring logic
Now that you have your state checking functions, simply call each feature in turn from a controller function. You can print the results and log a message each time the master check operation occurs:
# Hàm chạy các kiểm tra trạng thái def run_health_checks(): print("Monitoring the system.") log_message("Running system health checks.") check_cpu_usage() check_memory_usage() check_disk_space() check_network_traffic() log_message("Health checks completed.")The above code runs all the status checks, providing a unified view of the system's health status.
Schedule automatic tests and run the program
To monitor automatically at specific intervals, you'll use a scheduling library. You can adjust the time interval as needed.
# Lên lịch kiểm tra sức khỏe để chạy mỗi phút schedule.every(1).minutes.do(run_health_checks)Now runs the system monitoring process in a continuous loop.
# Vòng lặp chính để chạy các nhiệm vụ đã lên lịch while True: schedule.run_pending() time.sleep(1)This loop continuously checks scheduled tasks and deploys them on time. When running this program, the results are as follows:
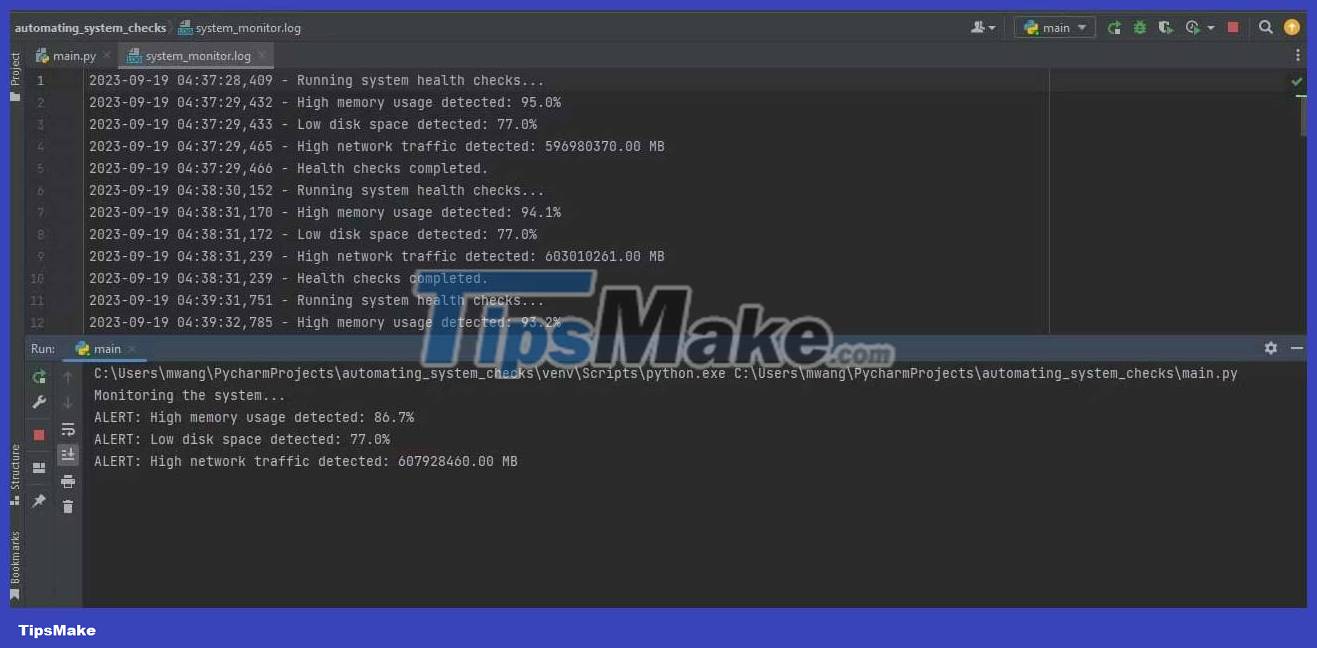
The program records monitoring records on the system_monitor.log file and displays notifications on the terminal.
Above is how to monitor the system automatically with Python . Hope the article is useful to you.
Was this article helpful?
Your feedback helps us improve.
Related Articles
 How to automate Outlook emails with Python7 minutes read
 How to automate GIMP by script9 minutes read
 3 best system monitoring tools for Ubuntu8 minutes read
 How to install Python on Windows, macOS, Linux5 minutes read
 7 tips for using ChatGPT to automate data tasks.5 minutes read
 Help () function in Python2 minutes read
Reader Comments 0
Sign in with email or Google to join the discussion.