POISSON function - The function returns the Poisson distribution in Excel
In predicting the number of events that occur within a specific time, one cannot help but use the POISSON function. The following article details how to use the POISSON function, the function returns the Poisson distribution.
In predicting the number of events that occur within a specific time, one cannot help but use the POISSON function. The following article details how to use the POISSON function, the function returns the Poisson distribution.
Description: The function returns the Poisson distribution, which is the basis for determining the number of events occurring over a defined period, for example, with the vehicle density on weekends, the number of vehicles passing through the toll booth in 1 minute. From the anticipation, there will be specific support measures.
Syntax: POISSON (x, mean, cumulative) .
Inside:
- x: Number of events, is a required parameter.
- mean: The value to be estimated (value in the form of numbers), is a required parameter.
- cumulative: A logical value that determines the format of the return value. The following values are available:
+ cumulative = TRUE => function returns the cumulative Poisson probability that 0
+ cumulative = FALSE: function returns the cumulative Poisson probability that the number of events = x.
Attention:
- Poission function is calculated by the formula:
+ cumulative = TRUE:

+ cumulative = FALSE:

- If x is a decimal, the function takes an integer value of x.
- x and the value must be numeric otherwise the function returns the #VALUE error.
- If x
- If mean the function returns the value #NUM !.
For example:
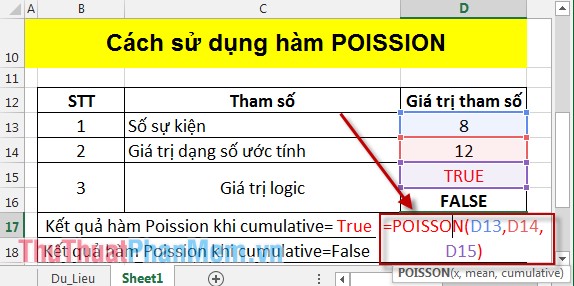
- Calculate Poission when cumulative = True :
In the cell to calculate enter the formula: = POISSON (D13, D14, D15) .
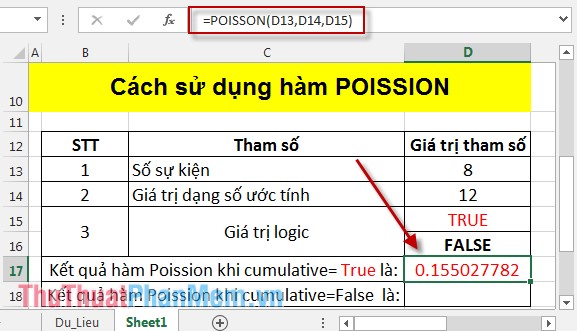
Pressing Enter results as:
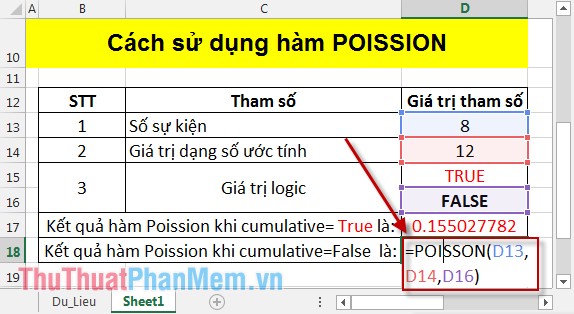
- Calculate Poission when cumulative = False :
In the cell to calculate enter the formula: = POISSON (D13, D14, D16) .
Pressing Enter results as:
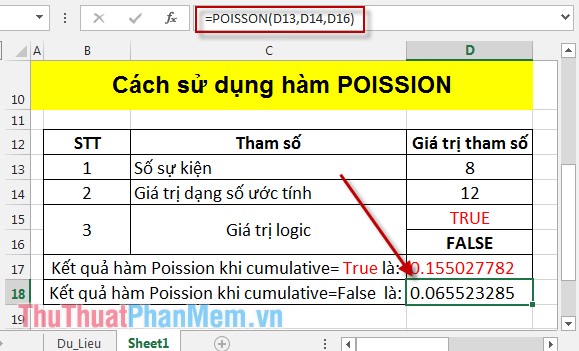
Thus the Poission function value at the cumulative value is different. Hopefully the Poission function will help you in predicting events that occur in a specified time period.
Good luck!
Was this article helpful?
Your feedback helps us improve.
Related Articles
 POISSON.DIST function - The function returns the Poisson distribution in Excel2 minutes read
 WEIBULL function - The function returns the Weibull distribution in Excel3 minutes read
 GAMMA.INV function - The function returns the inverse of the gamma distribution in Excel2 minutes read
 GAMMA.DIST function - The function returns the gamma distribution in Excel3 minutes read
 CHIDIST function - Function returns the right end probability of the distribution when squared in Excel2 minutes read
 How to use the NORMDIST function in Excel - Function that returns the distribution in Excel3 minutes read
Reader Comments 0
Sign in with email or Google to join the discussion.