PHI function - The function returns the value of the density function for a normal distribution in Excel
The following article introduces you to the PHI function - one of the functions in the statistical function group is very popular in Excel.
Description: The function returns the value of the density function for a standard normal distribution. Support functions from Excel 2013 onwards.
Syntax: PHI (x)
Inside:
- x: The value you want to determine normalized distribution, is a required parameter .
Attention:
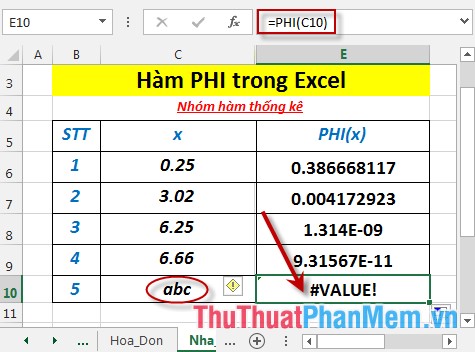
- If x is not numeric -> the function returns the #VALUE! Error value
- If x is an invalid numeric value -> the function returns the #NUM! Error value
For example:
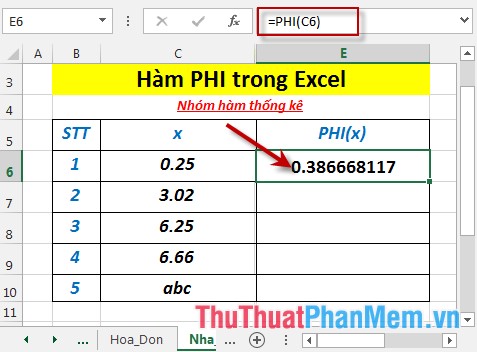
Calculate the value of the density function for a standard normal distribution described in the following data table:
- In the cell to calculate enter the formula : = PHI (C6)
- Press Enter -> normalized density function value of 0.25 is:
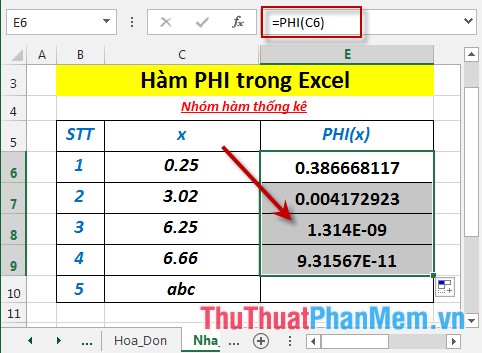
- Similarly copying the formula for the remaining values results:
- Where x is not a number -> the function returns the #VALUE! Error value
Above are instructions and some specific examples when using the PHI function in Excel.
Good luck!
You should read it
- POISSON.DIST function - The function returns the Poisson distribution in Excel
- POISSON function - The function returns the Poisson distribution in Excel
- GAMMA.INV function - The function returns the inverse of the gamma distribution in Excel
- FISHER function - The function returns the Fissher transformation at x in Excel
- CHIDIST function - Function returns the right end probability of the distribution when squared in Excel
- GAMMA.DIST function - The function returns the gamma distribution in Excel
- NORMDIST function - The function returns the normal distribution with the standard deviation and the average value specified in Excel
- BETA.DIST function - The function returns the Beta distribution in Excel
May be interested
- POISSON.DIST function - The function returns the Poisson distribution in Excelpoisson.dist function: the function returns the poisson distribution, the application function to predict the number of events in a specific time. support functions from excel 2013 onwards. syntax: poisson.dist (x, mean, cumulative)
- QUARTILE.EXC function - The function returns the quartile of a dataset without values 0 and 1 in Excelquartile.exc function: the function returns the quartile of the data set, with percentile values from 0 to 1 excluding 0 and 1. the support function is from excel 2010 onwards. syntax: quartile.exc (array, quart)
- QUARTILE.INC function - The function returns the quartile of a dataset including values 0 and 1 in Excelquartile.inc function: the function returns the quartile of a data set, with percentile values from 0 to 1 including 0 and 1. support functions from execl 2010 onwards. syntax: quartile.inc (array, quart)
- RANK.AVG function - The function returns the rank of a number in a list of numbers in Excelrank.avg function: the function returns the rank of a number in a list of numbers whose size is in correlation with other values. if multiple values have the same rank -> the function returns the average rank. support functions from execl 2010 version and above
- RSQ - The function returns the square of the Pearson torque correlation coefficient in Excelrsq: the function returns the square of the pearson moment correlation coefficient through data points in known_ys and known_xs. syntax: rsq (known_ys, known_xs)
- SKEW function - The function returns the deviation of the distribution in Excelskew function: the function returns the deviation of the distribution - the deviation represents the asymmetry of the distribution around its axis. - negative deviations: the distribution with the asymmetric side extends more to the negative value. - positive deviation: the distribution with the asymmetric side extends much to g