POISSON.DIST function - The function returns the Poisson distribution in Excel
The following article introduces you to the POISSON.DIST function - one of the functions in the statistical function group is very popular in Excel.
Description: The function returns the Poisson distribution, the application function to predict the number of events in a specific time. Support functions from Excel 2013 onwards.
Syntax: POISSON.DIST (x, mean, cumulative)
Inside:
- x: Number of events, is a required parameter .
- mean: The estimated numerical value, is a required parameter.
- cumulative: A logical value that determines the form of the function, which is a required parameter, including:
+ cumulative = True -> returns the cumulative distribution function.
+ cumulative = False -> returns the probability block function.
Attention:
- If x is not an integer -> it is truncated to an integer.
- If x or mean are not numeric -> the function returns the #VALUE! Error value
- If x <0 or mean <0 -> the function returns the #NUM! Error value
- The function POISSON.DIST with cumulative False is calculated based on the formula:
[{rm {POISSON}} = frac {{{e ^ {- lambda}} {lambda ^ x}}} {{x!}}]
- The function POISSON.DIST with cumulative True is calculated based on the formula:
[{rm {CUMPOISSON}} = sumlimits_ {k = 0} ^ x {frac {{{e ^ {- lambda}} {lambda ^ x}}} {{k!}}}]]
For example:
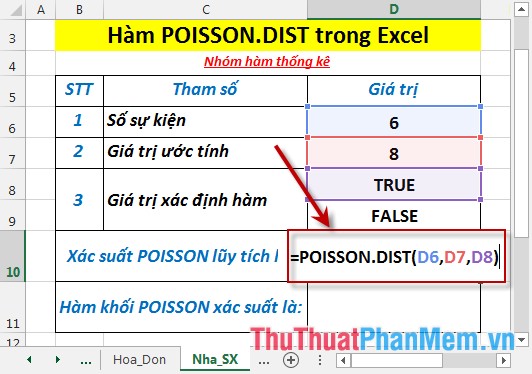
Calculate the probability of Poisson.dist with the data described in the following data table:
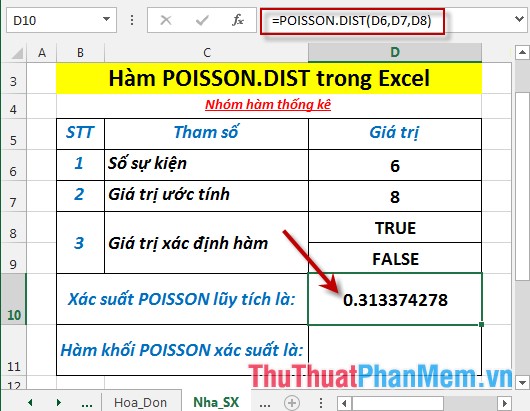
- Calculate cumulative probability POISSON . In a cell to calculate, enter the formula : = POISSON.DIST (D6, D7, D8)
- Press Enter -> the cumulative probability of POISSON is:
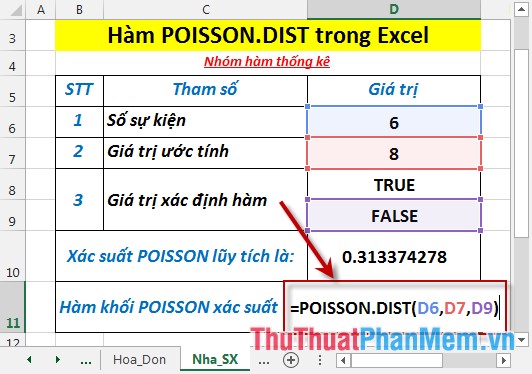
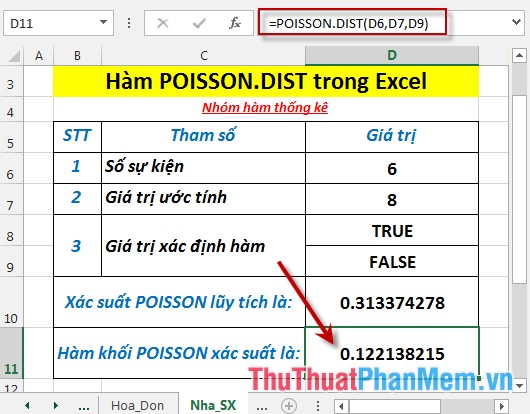
- Calculate probability function block POISSON . In a cell to calculate, enter the formula: = POISSON.DIST (D6, D7, D9)
- Press Enter -> return value is:
Above are instructions and some specific examples when using the POISSON.DIST function in Excel.
Good luck!
You should read it
- BETA.DIST function - The function returns the Beta distribution in Excel
- HYPGEOM.DIST - The function returns the hyperbolic distribution in Excel
- F.DIST - The function returns the probability distribution F in Excel
- T.DIST.RT - The function returns the Student's t-distribution on the right in Excel
- CHISQ.DIST - Function returns the distribution when squared in Excel
- LOGNORM.DIST - Function returns the logarithmic distribution of x in Excel
- T.DIST - The function returns the Student t-distribution on the left in Excel
- T.DIST.2T - The function returns the two-tailed Student distribution in Excel
May be interested
- QUARTILE.EXC function - The function returns the quartile of a dataset without values 0 and 1 in Excelquartile.exc function: the function returns the quartile of the data set, with percentile values from 0 to 1 excluding 0 and 1. the support function is from excel 2010 onwards. syntax: quartile.exc (array, quart)
- QUARTILE.INC function - The function returns the quartile of a dataset including values 0 and 1 in Excelquartile.inc function: the function returns the quartile of a data set, with percentile values from 0 to 1 including 0 and 1. support functions from execl 2010 onwards. syntax: quartile.inc (array, quart)
- RANK.AVG function - The function returns the rank of a number in a list of numbers in Excelrank.avg function: the function returns the rank of a number in a list of numbers whose size is in correlation with other values. if multiple values have the same rank -> the function returns the average rank. support functions from execl 2010 version and above
- RSQ - The function returns the square of the Pearson torque correlation coefficient in Excelrsq: the function returns the square of the pearson moment correlation coefficient through data points in known_ys and known_xs. syntax: rsq (known_ys, known_xs)
- SKEW function - The function returns the deviation of the distribution in Excelskew function: the function returns the deviation of the distribution - the deviation represents the asymmetry of the distribution around its axis. - negative deviations: the distribution with the asymmetric side extends more to the negative value. - positive deviation: the distribution with the asymmetric side extends much to g
- SLOPE function - The function returns the slope of a linear regression line through data points in Excelslope function: the function returns the slope of a linear regression line through data points. the slope is the vertical distance divided by the horizontal distance between any two points on that line, the rate of change along the regression line. syntax: slope (known_ys, known_xs)