Use Sparklines in Excel
Spark Lines in Excel is a small chart that you can put inside cells to view data and charts on the same table. You may know a lot about how to use Charts in Excel but maybe you do not know Sparklines.
Spark Lines in Excel is a small chart that you can put inside cells to view data and charts on the same table. You may know a lot about how to use Charts in Excel but maybe you do not know Sparklines.
The following article shows how to use Sparklines in Excel spreadsheets.
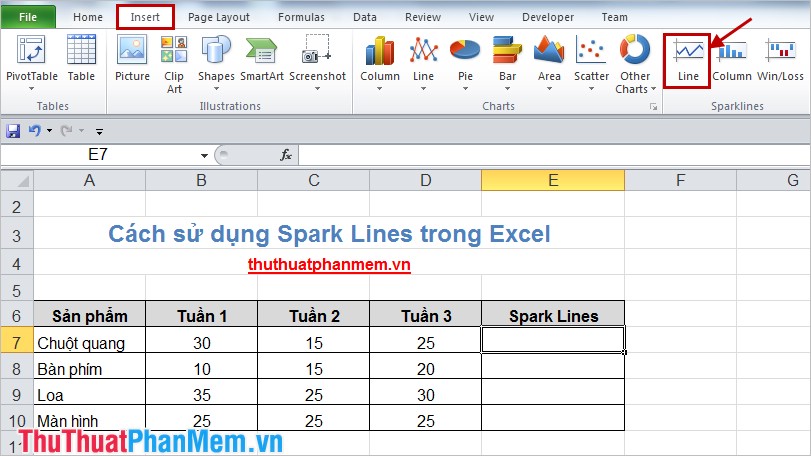
Step 1: You need to open the Excel file containing the numeric data you want to create a trend chart for that data. Then you select the Excel cell that you want to place Sparklines. Select the Insert tab and in the Sparklines section you select the type of chart you want to draw, for example choose Line .
Step 2: In the dialog box Create Sparklines , you enter the data cells you want to create a chart in the Data Range . Part Location Range is the cell that will contain the chart.
You can select data to draw multiple charts at the same time in Data Range and corresponding to Location Range .
Then click OK .

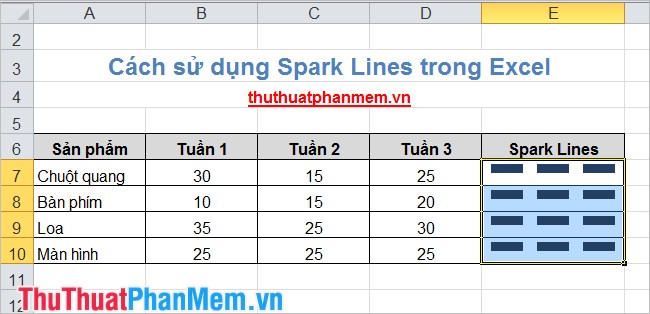
The charts will be displayed in the cells you select in the Location Range .

If you want to change the type of chart you select the chart to change the style, there will appear Design tab you select the type in Type .

- Column chart :

- Win / Loss chart :
If you apply Sparklines in accordance with the purpose, you will clearly see the effect that Sparklines brings. The process of tracking and analyzing data will be quicker and easier. Good luck!
Was this article helpful?
Your feedback helps us improve.
Related Articles
 How to use Sparklines in Excel 20102 minutes read
 Get started with Excel for beginners4 minutes read
 Tips for adding in Excel you need to know3 minutes read
 How to fix the SUM function doesn't add up in Excel2 minutes read
 Guidance on how to align Excel correctly3 minutes read
 How to keep Excel and Excel columns fixed?2 minutes read
Reader Comments 0
Sign in with email or Google to join the discussion.